Introduction
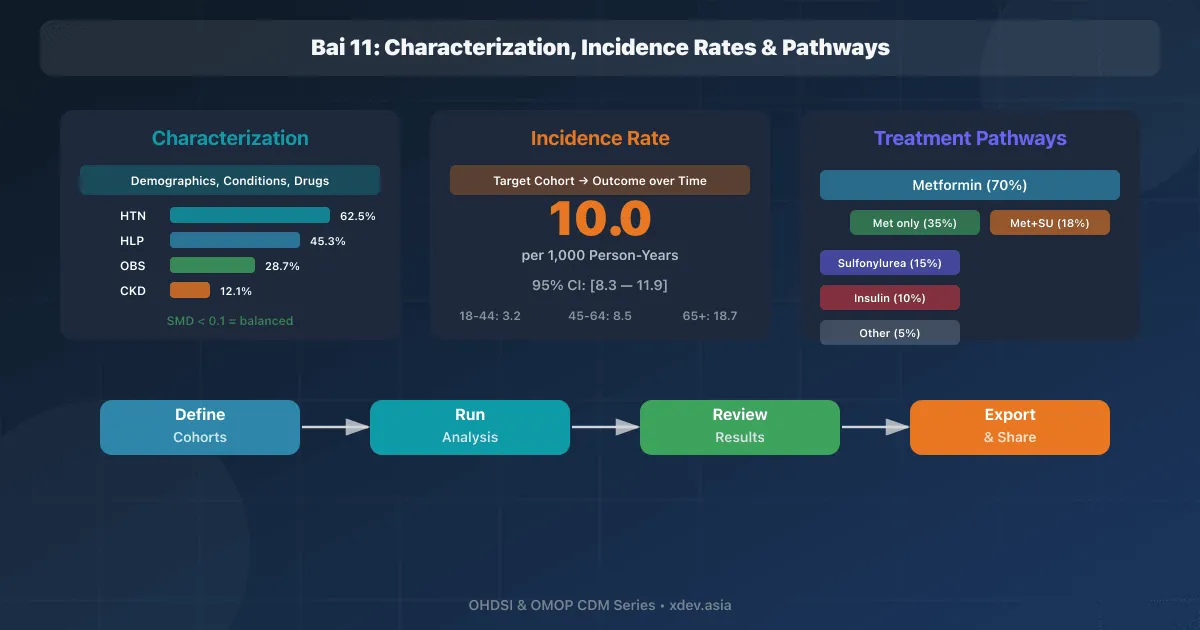
Once Cohort Definitions have been created, the next step is cohort analysis — characterizing (Characterization), calculating incidence rates (Incidence Rates), and analyzing treatment pathways (Pathways).
1. Cohort Characterization
1.1 Purpose
Characterization answers the question: "What does my patient's Cohort look like?"
Ví dụ: Cohort "New-Onset Type 2 DM" (4,200 bệnh nhân)
Muốn biết:
- Phân bố tuổi, giới tính?
- Bệnh đi kèm phổ biến (comorbidities)?
- Thuốc đang dùng tại thời điểm chẩn đoán?
- Xét nghiệm gần nhất (HbA1c, glucose, BMI)?
1.2 Create Characterization in ATLAS
ATLAS → Characterizations → New Characterization

Setup:
┌─────────────────────────────────────────────────────────┐
│  Characterization: DM Type 2 Patient Profile            │
│                                                         │
│  Cohorts:                                               │
│  ☑ New-Onset Type 2 DM (cohort #1)                     │
│  ☑ Type 2 DM Với Metformin (cohort #2) — so sánh       │
│                                                         │
│  Feature Analyses:                                      │
│  ☑ Demographics (Gender, Age)                           │
│  ☑ Conditions in prior 365 days                         │
│  ☑ Drug Exposures in prior 365 days                     │
│  ☑ Measurements in prior 365 days                       │
│  ☑ Visit Count in prior 365 days                        │
│  ☑ Charlson Comorbidity Index                           │
│                                                         │
│  [▶ Execute]                                            │
└─────────────────────────────────────────────────────────┘
1.3 Characterization Results
Demographics:
┌────────────────────────┬────────────────┬────────────────┐
│ Feature                │ Cohort 1       │ Cohort 2       │
│                        │ (New DM)       │ (DM+Metformin) │
├────────────────────────┼────────────────┼────────────────┤
│ Male                   │ 52.3%          │ 48.1%          │
│ Female                 │ 47.7%          │ 51.9%          │
│ Age 18-44              │ 15.2%          │ 12.0%          │
│ Age 45-64              │ 48.5%          │ 52.3%          │
│ Age 65+                │ 36.3%          │ 35.7%          │
│ Mean age               │ 57.2 years     │ 58.8 years     │
└────────────────────────┴────────────────┴────────────────┘

Top Conditions (prior 365 days):
┌──────────────────────────────────┬──────────┬──────────┐
│ Condition                        │ Cohort 1 │ Cohort 2 │
├──────────────────────────────────┼──────────┼──────────┤
│ Essential hypertension           │ 62.5%    │ 68.2%    │
│ Hyperlipidemia                   │ 45.3%    │ 51.0%    │
│ Obesity                          │ 28.7%    │ 25.4%    │
│ Chronic kidney disease           │ 12.1%    │ 15.8%    │
│ Ischemic heart disease           │  8.5%    │ 10.2%    │
└──────────────────────────────────┴──────────┴──────────┘

Measurements (prior 365 days):
┌──────────────────────────────────┬──────────┬──────────┐
│ Measurement                      │ Cohort 1 │ Cohort 2 │
├──────────────────────────────────┼──────────┼──────────┤
│ HbA1c (mean)                     │ 8.2%     │ 7.5%     │
│ Fasting Glucose (mean)           │ 165 mg/dL│ 135 mg/dL│
│ BMI (mean)                       │ 27.8     │ 26.9     │
│ Creatinine (mean)                │ 1.1 mg/dL│ 1.2 mg/dL│
└──────────────────────────────────┴──────────┴──────────┘
1.4 Standardized Mean Difference (SMD)
ATLAS tính SMD giữa 2 cohorts:
  SMD > 0.1: Khác biệt có ý nghĩa (cần chú ý)
  SMD < 0.1: Tương đồng

Ví dụ:
  Essential HTN: |62.5% - 68.2%| → SMD = 0.12 (khác biệt nhẹ)
  Mean Age: |57.2 - 58.8| → SMD = 0.08 (tương đồng)

→ Quan trọng cho Estimation studies (balance assessment)
2. Incidence Rate Analysis
2.1 Concepts
Incidence Rate = số ca mới / tổng thời gian at-risk

Trả lời: "Bao nhiêu bệnh nhân phát triển [outcome]
          trong [target cohort] theo thời gian?"

Ví dụ:
  Target: Bệnh nhân Type 2 DM mới khởi phát
  Outcome: Nhồi máu cơ tim (Acute MI)
  → Tỷ lệ mới mắc MI ở bệnh nhân DM type 2?
2.2 Configuration in ATLAS
ATLAS → Incidence Rates → New IR Analysis

┌─────────────────────────────────────────────────────────┐
│  Incidence Rate: MI in Type 2 DM                        │
│                                                         │
│  Target Cohort:                                         │
│  [New-Onset Type 2 DM ▼]                               │
│                                                         │
│  Outcome Cohort:                                        │
│  [Acute Myocardial Infarction ▼]                       │
│                                                         │
│  Time At Risk:                                          │
│  Start: Cohort start date + [0] days                    │
│  End:   Cohort end date + [0] days                      │
│                                                         │
│  ☑ Exclude persons with prior outcome                   │
│     (loại BN đã từng có MI trước)                       │
│                                                         │
│  [▶ Execute]                                            │
└─────────────────────────────────────────────────────────┘
2.3 Incidence Rate Results
Results:
┌──────────────────────────────────────────────────────┐
│  Target: New-Onset Type 2 DM                         │
│  Outcome: Acute Myocardial Infarction                │
│                                                      │
│  Persons at risk:        4,200                       │
│  Person-years at risk:   12,600 PY                   │
│  Outcome events:         126                         │
│                                                      │
│  Incidence Rate:         10.0 per 1,000 PY           │
│  95% CI:                 [8.3 - 11.9]                │
│                                                      │
│  By Age Group:                                       │
│  ├── 18-44:  3.2 per 1,000 PY                       │
│  ├── 45-64:  8.5 per 1,000 PY                       │
│  └── 65+:   18.7 per 1,000 PY                       │
│                                                      │
│  By Gender:                                          │
│  ├── Male:   12.3 per 1,000 PY                       │
│  └── Female:  7.8 per 1,000 PY                       │
└──────────────────────────────────────────────────────┘
3. Treatment Pathways
3.1 Concepts
Treatment Pathway = lộ trình điều trị theo thời gian

Trả lời: "Bệnh nhân [target cohort] được điều trị theo
          trình tự nào? Thuốc đầu tiên là gì? Thay đổi
          thuốc khi nào?"

Ví dụ: Lộ trình điều trị Type 2 DM
  Patient 1: Metformin → Metformin + Glipizide → Insulin
  Patient 2: Metformin → Metformin + SGLT2i
  Patient 3: Metformin (mono therapy duy trì)
3.2 Configure Pathway Analysis
ATLAS → Pathways → New Pathway Analysis

┌─────────────────────────────────────────────────────────┐
│  Pathway: DM Treatment Pathway                          │
│                                                         │
│  Target Cohort:                                         │
│  [New-Onset Type 2 DM ▼]                               │
│                                                         │
│  Event Cohorts (các thuốc theo dõi):                   │
│  ☑ Metformin Users                                     │
│  ☑ Sulfonylurea Users                                  │
│  ☑ SGLT2 Inhibitor Users                               │
│  ☑ DPP-4 Inhibitor Users                               │
│  ☑ GLP-1 RA Users                                      │
│  ☑ Insulin Users                                        │
│                                                         │
│  Settings:                                              │
│  Combination window: [30] days                          │
│  Minimum cell count: [5]                                │
│  Max path length: [5]                                   │
│                                                         │
│  [▶ Execute]                                            │
└─────────────────────────────────────────────────────────┘
3.3 Sunburst Diagram
ATLAS vẽ Sunburst diagram:

                    ┌─ Metformin only (35%)
                    │
        ┌── Met ────┼─ Met → Met+SU (18%)
        │   (70%)   │
        │           └─ Met → Met+SGLT2i (12%)
Start ──┤
        │           ┌─ SU only (5%)
        ├── SU ─────┤
        │   (15%)   └─ SU → SU+Met (8%)
        │
        ├── Insulin (10%)
        │
        └── Other (5%)

→ 70% bệnh nhân bắt đầu với Metformin (đúng guideline)
→ 18% chuyển sang combination Met+SU
→ 10% bắt đầu trực tiếp Insulin (DM nặng)
4. Export & Share Results
4.1 Export Cohort Definition
// ATLAS → Cohort Definition → Export → JSON
{
  "ConceptSets": [...],
  "PrimaryCriteria": {
    "CriteriaList": [{
      "ConditionOccurrence": {
        "CodesetId": 0,
        "First": true
      }
    }],
    "ObservationWindow": {"PriorDays": 365, "PostDays": 0}
  },
  "AdditionalCriteria": {...},
  "EndStrategy": {"DateOffset": {...}}
}
4.2 Import to another site
Site B muốn chạy cùng analysis:
1. Nhận JSON cohort definition
2. ATLAS → Cohort Definitions → Import
3. Paste JSON → Save
4. Generate trên local CDM data
5. Export aggregate results

→ Dữ liệu BN không rời site
→ Chỉ share cohort definition + aggregate results
Summary
| Analysis | Questions and Answers |
|---|---|
| Characterization | What does a cohort look like? (demographics, comorbidities, drugs) |
| Incidence Rate | How many new cases [outcome] in [target] over time? |
| Pathways | In what order are patients treated? |
| SMD | In what characteristics do the two cohorts differ? |
Next article: ATLAS — Population-Level Estimation & Patient-Level Prediction