Introduction
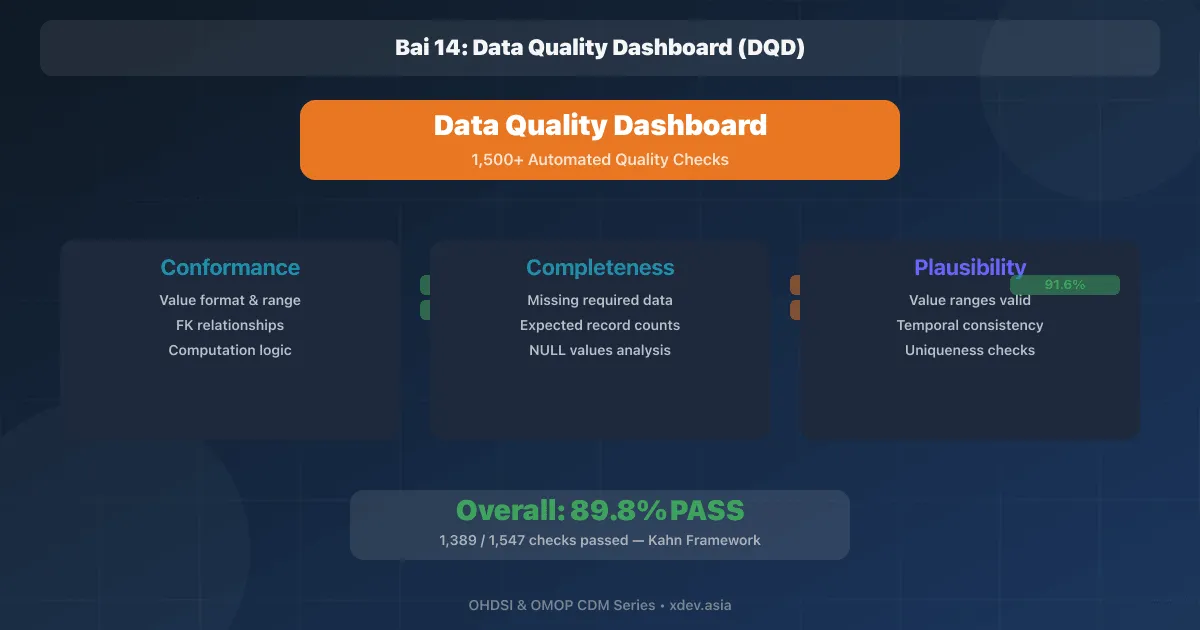
Data Quality Dashboard (DQD) is an OHDSI tool that systematically evaluates CDM data quality. DQD runs more than 1,500 checks automatically and generates PASS/FAIL reports to help detect data problems before analysis.
So sánh ACHILLES vs DQD:

ACHILLES:
  "Dữ liệu trông như thế nào?"
  → Descriptive statistics, profiling
  → Vẽ biểu đồ trong ATLAS

DQD:
  "Dữ liệu có ĐẠT CHUẨN không?"
  → 1,500+ quality checks
  → PASS / FAIL judgement
  → Action items cụ thể
1. Kahn Framework
1.1 Three Dimensional Data Quality
DQD dựa trên Kahn et al. (2016) framework:

┌──────────────────────────────────────────────────────┐
│            DATA QUALITY FRAMEWORK                    │
│                                                      │
│  ┌────────────────┐  ┌────────────────┐              │
│  │  Conformance   │  │  Completeness  │              │
│  │  (Tuân thủ)    │  │  (Đầy đủ)     │              │
│  ├────────────────┤  ├────────────────┤              │
│  │ • Value        │  │ • Missing data │              │
│  │ • Relational   │  │ • Expected     │              │
│  │ • Computation  │  │   records      │              │
│  └────────────────┘  └────────────────┘              │
│                                                      │
│  ┌────────────────┐                                  │
│  │  Plausibility  │  Mỗi chiều chia thành:           │
│  │  (Hợp lý)     │  • Verification (internal)       │
│  ├────────────────┤  • Validation (external)         │
│  │ • Uniqueness   │                                  │
│  │ • Atemporal    │                                  │
│  │ • Temporal     │                                  │
│  └────────────────┘                                  │
└──────────────────────────────────────────────────────┘
1.2 Example of each dimension
Conformance — Value:
  "Giá trị có đúng format/range không?"
  ✓ gender_concept_id ∈ {8507, 8532}
  ✗ gender_concept_id = 0 → unmapped!

Conformance — Relational:
  "FK references có hợp lệ không?"
  ✓ condition_concept_id tồn tại trong concept table
  ✗ person_id không tìm thấy trong person table

Completeness:
  "Có thiếu data quan trọng không?"
  ✓ 98% conditions có concept_id ≠ 0
  ✗ 40% measurements thiếu unit_concept_id

Plausibility — Atemporal:
  "Giá trị có hợp lý không?"
  ✓ HbA1c values ∈ [3%, 20%]
  ✗ Body weight = 5000 kg

Plausibility — Temporal:
  "Trình tự thời gian có đúng không?"
  ✓ drug_start_date ≤ drug_end_date
  ✗ condition_date trước birth_date
2. Install & Run DQD
2.1 Installation
install.packages("remotes")
remotes::install_github("OHDSI/DataQualityDashboard")
2.2 Run DQD
library(DataQualityDashboard)
library(DatabaseConnector)

connectionDetails <- createConnectionDetails(
  dbms = "postgresql",
  server = "localhost/ohdsi",
  user = "ohdsi_app",
  password = keyring::key_get("ohdsi_password"),
  port = 5432
)

# Output folder
outputFolder <- "output/dqd_results"
dir.create(outputFolder, recursive = TRUE)

# Chạy DQD
DataQualityDashboard::executeDqChecks(
  connectionDetails = connectionDetails,
  cdmDatabaseSchema = "cdm",
  resultsDatabaseSchema = "results",
  vocabDatabaseSchema = "cdm",
  cdmSourceName = "Hospital_VN_2024",
  numThreads = 4,
  sqlOnly = FALSE,
  outputFolder = outputFolder,
  outputFile = "Hospital_VN_2024.json",
  writeToTable = TRUE,
  checkLevels = c("TABLE", "FIELD", "CONCEPT"),
  checkNames = c(),          # empty = run ALL checks
  tablesToExclude = c()      # exclude nothing
)
2.3 View Dashboard
# Mở dashboard web
DataQualityDashboard::viewDqDashboard(
  jsonPath = file.path(outputFolder, "Hospital_VN_2024.json")
)

# → Mở browser tại http://localhost:xxxx
3. DQD results
3.1 Overview
┌─────────────────────────────────────────────────────────┐
│  Data Quality Dashboard — Hospital_VN_2024              │
│  CDM Version: 5.4 | Run Date: 2024-12-15               │
│                                                         │
│  Total Checks:   1,547                                  │
│  PASS:           1,389 (89.8%)                          │
│  FAIL:             128 (8.3%)                           │
│  Not Applicable:    30 (1.9%)                           │
│                                                         │
│  ████████████████████░░ 89.8% PASS                     │
│                                                         │
│  By Category:                                           │
│  ┌──────────────┬──────┬──────┬──────┐                  │
│  │ Category     │ Pass │ Fail │ %    │                  │
│  ├──────────────┼──────┼──────┼──────┤                  │
│  │ Conformance  │  520 │   35 │ 93.7%│                  │
│  │ Completeness │  380 │   48 │ 88.8%│                  │
│  │ Plausibility │  489 │   45 │ 91.6%│                  │
│  └──────────────┴──────┴──────┴──────┘                  │
└─────────────────────────────────────────────────────────┘
3.2 Detailed Checks — Conformance
FAIL checks — Conformance:
┌────────────────────────────────────────────────────────────────┐
│ Check: measureValueCompleteness                                │
│ Table: measurement                                             │
│ Field: unit_concept_id                                         │
│ Status: FAIL                                                   │
│ Threshold: ≤ 40% missing → FAIL                                │
│ Result: 42.5% records have unit_concept_id = 0                 │
│                                                                │
│ → 42.5% measurements thiếu unit (ví dụ: mg/dL, mmol/L)        │
│ → Cần mapping units trong ETL                                  │
├────────────────────────────────────────────────────────────────┤
│ Check: cdmField (isRequired)                                   │
│ Table: drug_exposure                                           │
│ Field: drug_exposure_end_date                                  │
│ Status: FAIL                                                   │
│ Result: 15,230 records (8.2%) have NULL end_date               │
│                                                                │
│ → Required field bị NULL                                       │
│ → ETL cần set end_date = start_date + days_supply              │
└────────────────────────────────────────────────────────────────┘
3.3 Detailed Checks — Plausibility
FAIL checks — Plausibility:
┌────────────────────────────────────────────────────────────────┐
│ Check: plausibleValueLow                                       │
│ Table: measurement                                             │
│ Field: value_as_number                                         │
│ Concept: Body weight (concept_id = 3025315)                    │
│ Status: FAIL                                                   │
│ Result: 85 records with weight < 0 kg                          │
│                                                                │
│ → Âm? Impossible. Check ETL conversion                         │
├────────────────────────────────────────────────────────────────┤
│ Check: plausibleValueHigh                                      │
│ Table: measurement                                             │
│ Field: value_as_number                                         │
│ Concept: Systolic BP (concept_id = 3004249)                    │
│ Status: FAIL                                                   │
│ Result: 120 records with SBP > 300 mmHg                        │
│                                                                │
│ → SBP > 300: data entry error hoặc unit conversion error       │
├────────────────────────────────────────────────────────────────┤
│ Check: plausibleTemporalAfter                                  │
│ Table: drug_exposure                                           │
│ Field: drug_exposure_end_date                                  │
│ Status: FAIL                                                   │
│ Result: 350 records where end_date < start_date                │
│                                                                │
│ → Ngày kết thúc trước ngày bắt đầu: lỗi ETL                  │
└────────────────────────────────────────────────────────────────┘
4. Configure Thresholds
4.1 Custom Thresholds
# DQD dùng file CSV threshold mặc định
# Có thể override cho từng check

# Xem thresholds mặc định
thresholds <- DataQualityDashboard::getDefaultThresholds()
head(thresholds)

# Custom threshold file
# threshold_overrides.csv:
# checkName,tableName,fieldName,conceptId,
#   thresholdValue,notesValue
# measureValueCompleteness,measurement,unit_concept_id,,
#   50,Cho phép 50% missing vì legacy data
# plausibleValueHigh,measurement,value_as_number,3004249,
#   5,Chấp nhận 5% SBP outliers
4.2 Exclude Checks
# Loại bỏ checks không áp dụng
DataQualityDashboard::executeDqChecks(
  connectionDetails = connectionDetails,
  cdmDatabaseSchema = "cdm",
  resultsDatabaseSchema = "results",
  cdmSourceName = "Hospital_VN_2024",
  outputFolder = outputFolder,
  # Chỉ chạy TABLE-level checks
  checkLevels = c("TABLE"),
  # Hoặc loại bỏ bảng không có data
  tablesToExclude = c("note", "note_nlp", "specimen", "episode")
)
5. Plan for Improvement
5.1 Priority Matrix
Urgency vs Impact:

         High Impact
              │
     Fix Now  │  Critical
  ┌───────────┼───────────┐
  │ Temporal  │ Missing   │
  │ violations│ concept_id│
  │           │ (mapping) │
  │───────────┼───────────│  High
  │ Outlier   │ Missing   │  Urgency
  │ values    │ required  │
  │ (few)     │ fields    │
  └───────────┼───────────┘
     Monitor  │  Plan Fix
              │
         Low Impact
5.2 Action Plan Template
┌────┬───────────────────────┬──────────┬───────────┬─────────┐
│ #  │ Issue                 │ Priority │ Owner     │ ETA     │
├────┼───────────────────────┼──────────┼───────────┼─────────┤
│  1 │ 42.5% missing units   │ HIGH     │ ETL team  │ Sprint 1│
│  2 │ 350 end < start dates │ HIGH     │ ETL team  │ Sprint 1│
│  3 │ 85 negative weights   │ MEDIUM   │ ETL team  │ Sprint 2│
│  4 │ 120 SBP > 300         │ MEDIUM   │ Data QA   │ Sprint 2│
│  5 │ 8.2% NULL end_date    │ HIGH     │ ETL team  │ Sprint 1│
│  6 │ 12% unmapped codes    │ MEDIUM   │ Vocab team│ Sprint 3│
└────┴───────────────────────┴──────────┴───────────┴─────────┘
5.3 Monitor progress
# Chạy DQD sau mỗi sprint
# So sánh kết quả qua thời gian

# Sprint 0: 89.8% PASS (baseline)
# Sprint 1: 93.2% PASS (+3.4%)  — fixed temporal + missing fields
# Sprint 2: 95.1% PASS (+1.9%)  — fixed outliers
# Sprint 3: 96.8% PASS (+1.7%)  — improved mapping

# Mục tiêu: ≥ 95% PASS trước khi chạy analysis
6. CI/CD integration
6.1 Automatically run DQD after ETL
#!/bin/bash
# /opt/ohdsi/scripts/run_dqd.sh

echo "Starting DQD run: $(date)"

Rscript -e '
library(DataQualityDashboard)
library(DatabaseConnector)

connectionDetails <- createConnectionDetails(
  dbms = "postgresql",
  server = Sys.getenv("CDM_DB_SERVER"),
  user = Sys.getenv("CDM_DB_USER"),
  password = Sys.getenv("CDM_DB_PASS"),
  port = 5432
)

results <- executeDqChecks(
  connectionDetails = connectionDetails,
  cdmDatabaseSchema = "cdm",
  resultsDatabaseSchema = "results",
  cdmSourceName = "Hospital_VN_2024",
  outputFolder = "/opt/ohdsi/dqd_output",
  outputFile = paste0("dqd_", Sys.Date(), ".json"),
  writeToTable = TRUE
)

# Check pass rate
passRate <- results$overview$percentPassed
cat("Pass rate:", passRate, "%\n")

if (passRate < 90) {
  quit(status = 1)  # fail pipeline
}
'

if [ $? -ne 0 ]; then
  echo "DQD FAILED: Pass rate below 90%"
  # Gửi alert
  exit 1
fi

echo "DQD PASSED: $(date)"
Summary
| Ingredients | Role |
|---|---|
| Kahn Framework | 3 dimensions: Conformance, Completeness, Plausibility |
| DQD Checks | 1,500+ automated quality checks |
| Thresholds | Configurable PASS/FAIL thresholds |
| Dashboard | Interactive web report |
| Action Plan | Priority matrix for improvement |
| CI/CD | Automatically check after each ETL run |
Next article: HADES — R Packages for Observational Studies