Introduction
In distributed architecture, debugging equals console.log not feasible. When a request goes through 5 services, you need observability to know where the request goes, how long it takes, and where it fails.
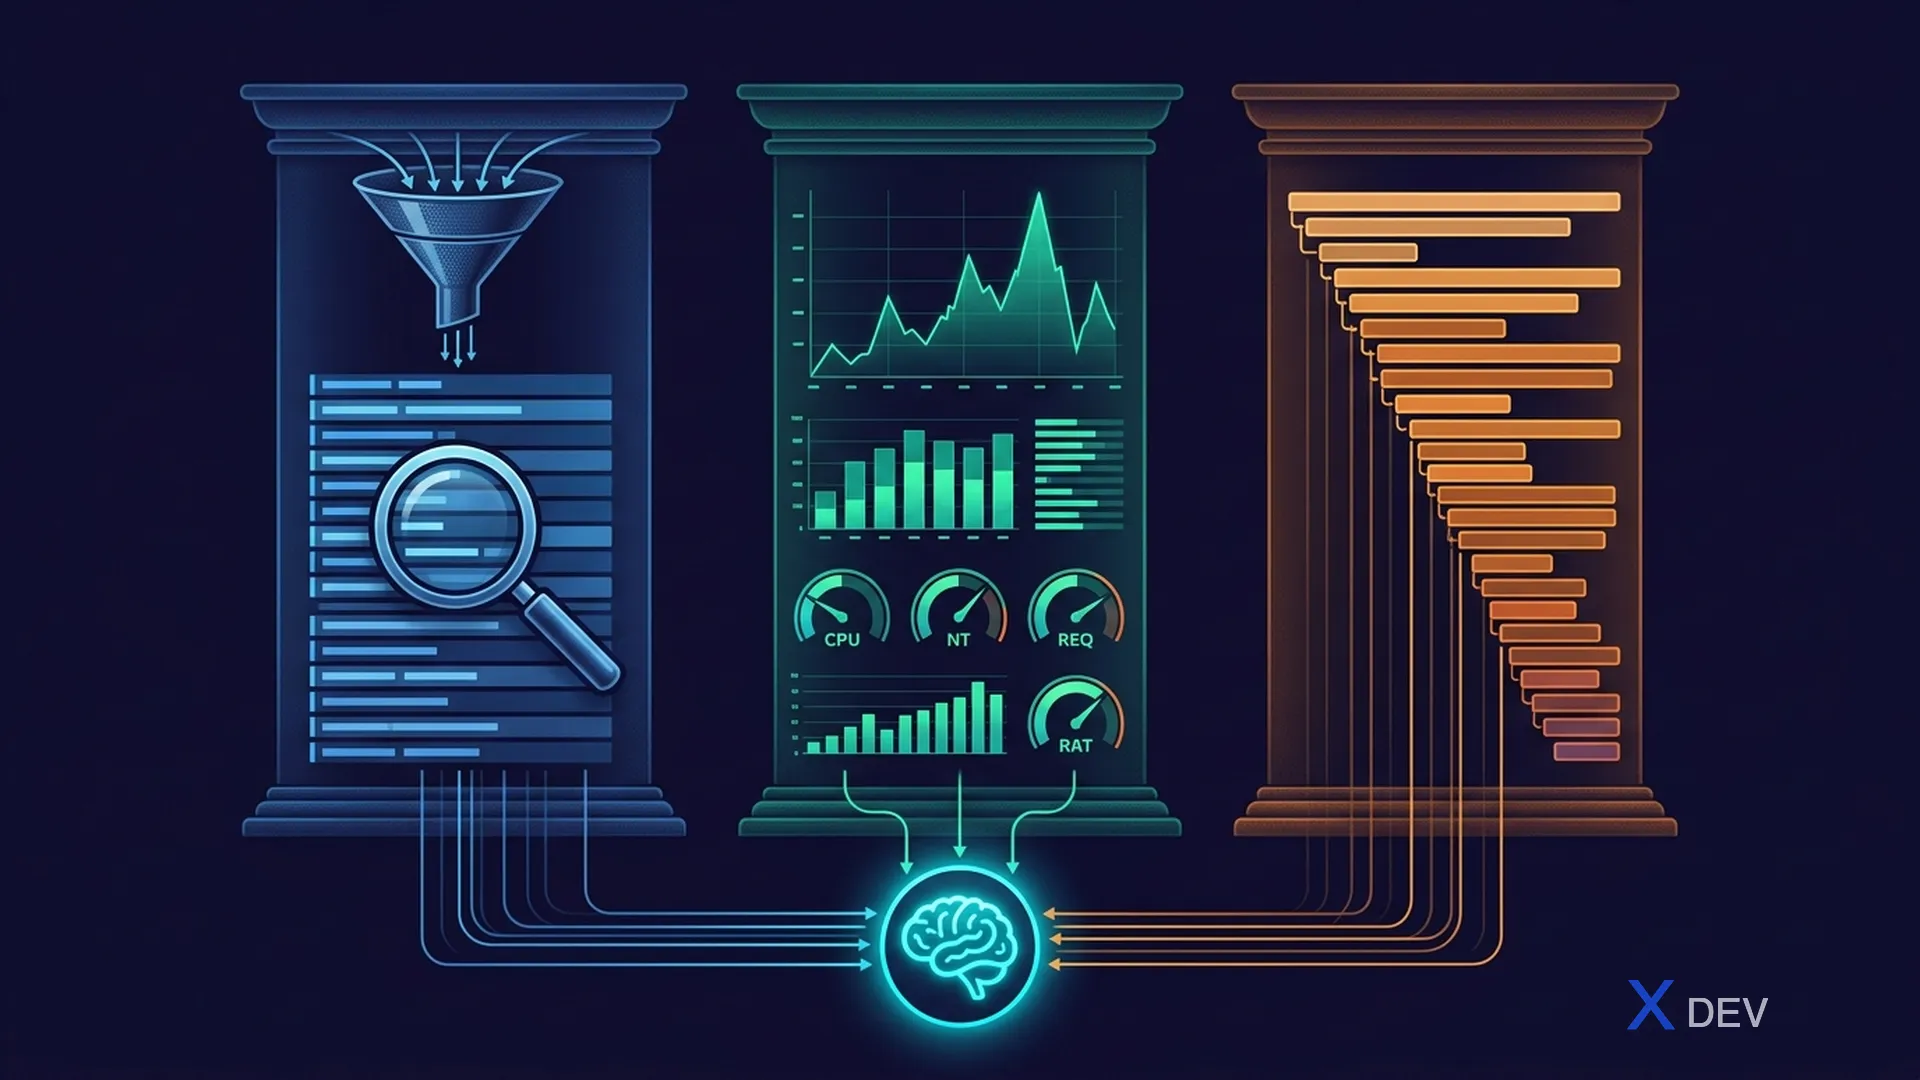
1. Three Pillars of Observability
┌─────────────────────────────────────────────┐
│              Observability                  │
├──────────────┬──────────────┬───────────────┤
│    Logs      │   Metrics    │   Traces      │
│              │              │               │
│ What happened│ How system   │ Request flow  │
│ (events)     │ performs     │ across svcs   │
│              │ (numbers)    │ (journey)     │
│              │              │               │
│ Loki/ELK     │ Prometheus   │ Tempo/Jaeger  │
└──────────────┴──────────────┴───────────────┘
2. Distributed Tracing
2.1 Trace an end-to-end request
User clicks "Place Order" trên frontend:

Trace ID: abc-123-def
├── Span 1: Shell App → POST /api/orders (200ms)
│   ├── Span 2: API Gateway → route to Order Service (5ms)
│   │   ├── Span 3: Order Service → validate (10ms)
│   │   ├── Span 4: Order Service → call Product Service (50ms)
│   │   │   └── Span 5: Product Service → DB query (15ms)
│   │   ├── Span 6: Order Service → call Payment Service (100ms)
│   │   │   └── Span 7: Payment Service → Stripe API (80ms)
│   │   └── Span 8: Order Service → publish OrderPlaced event (5ms)
│   └── Span 9: API Gateway → response (5ms)
└── Total: 200ms

→ Bottleneck: Payment Service → Stripe API (80ms) = 40% total
2.2 OpenTelemetry Setup (Node.js)
// tracing.js - Setup OpenTelemetry
const { NodeSDK } = require('@opentelemetry/sdk-node');
const { OTLPTraceExporter } = require('@opentelemetry/exporter-trace-otlp-http');
const { getNodeAutoInstrumentations } = require('@opentelemetry/auto-instrumentations-node');

const sdk = new NodeSDK({
  traceExporter: new OTLPTraceExporter({
    url: 'http://otel-collector:4318/v1/traces',
  }),
  instrumentations: [
    getNodeAutoInstrumentations({
      '@opentelemetry/instrumentation-http': { enabled: true },
      '@opentelemetry/instrumentation-express': { enabled: true },
      '@opentelemetry/instrumentation-pg': { enabled: true },
    }),
  ],
  serviceName: 'product-service',
});

sdk.start();
3. Metrics (Prometheus)
3.1 Key Metrics (RED Method)
| Metrics | What | AlertWhen |
|---|---|---|
| Rate | Requests per second | Sudden drop |
| Errors | Error rate (5xx) | > 1% |
| Duration | Latency (p50, p95, p99) | p99 > 2s |
3.2 Custom Metrics
const { meter } = require('@opentelemetry/api');

const orderCounter = meter.createCounter('orders_created_total', {
  description: 'Total orders created',
});

const orderDuration = meter.createHistogram('order_processing_duration_ms', {
  description: 'Order processing time',
});

// Usage
orderCounter.add(1, { status: 'success', payment_method: 'stripe' });
orderDuration.record(duration, { service: 'order-service' });
4. Structured Logging (Loki)
// Structured JSON logs
const logger = require('pino')({
  level: 'info',
});

app.use((req, res, next) => {
  const traceId = req.headers['x-trace-id'] || generateTraceId();
  req.log = logger.child({
    traceId,
    service: 'product-service',
    requestId: req.id,
  });
  next();
});

// Usage
req.log.info({ productId: '123', action: 'getProduct' }, 'Product fetched');
req.log.error({ error: err.message, stack: err.stack }, 'Product not found');
5. Grafana Stack
┌──────────────────────────────────────────┐
│              Grafana UI                  │
│  Dashboards │ Alerts │ Explore │ Traces  │
├──────────┬──────────┬────────────────────┤
│  Loki    │Prometheus│     Tempo          │
│  (Logs)  │(Metrics) │    (Traces)        │
├──────────┴──────────┴────────────────────┤
│         OpenTelemetry Collector          │
│  Receives → Processes → Exports          │
├──────────────────────────────────────────┤
│         Applications                     │
│  Microservices → OTLP → Collector        │
│  MFE → Web Vitals → Collector            │
└──────────────────────────────────────────┘
6. Frontend Observability (Micro Frontend)
// Web Vitals tracking
import { onLCP, onFID, onCLS } from 'web-vitals';

onLCP((metric) => {
  sendToCollector('web_vitals_lcp', metric.value, {
    mfe: 'product-mfe',
    page: window.location.pathname,
  });
});

// Error tracking
window.addEventListener('error', (event) => {
  sendToCollector('frontend_error', {
    message: event.message,
    stack: event.error?.stack,
    mfe: detectMFE(event.filename),
  });
});
Summary
| Pillars | Tools | Purpose |
|---|---|---|
| Logs | Loki + Pino | What happened (structured JSON) |
| Metrics | Prometheus | How system performs (RED method) |
| Traces | Tempo + OTEL | Request flow across services |
| Frontend | Web Vitals | Core Web Vitals per MFE |
| Dashboards | Grafana | Unified visualization |
Next article: Lesson 27: Performance Optimization — Frontend & Backend