Having a CDM is only the starting point. To extract value you need the tooling: ATLAS (cohort + characterization UI), DQD (data quality), and ACHILLES (profiling). This article walks through installing and running them.
1. The OHDSI analytics stack
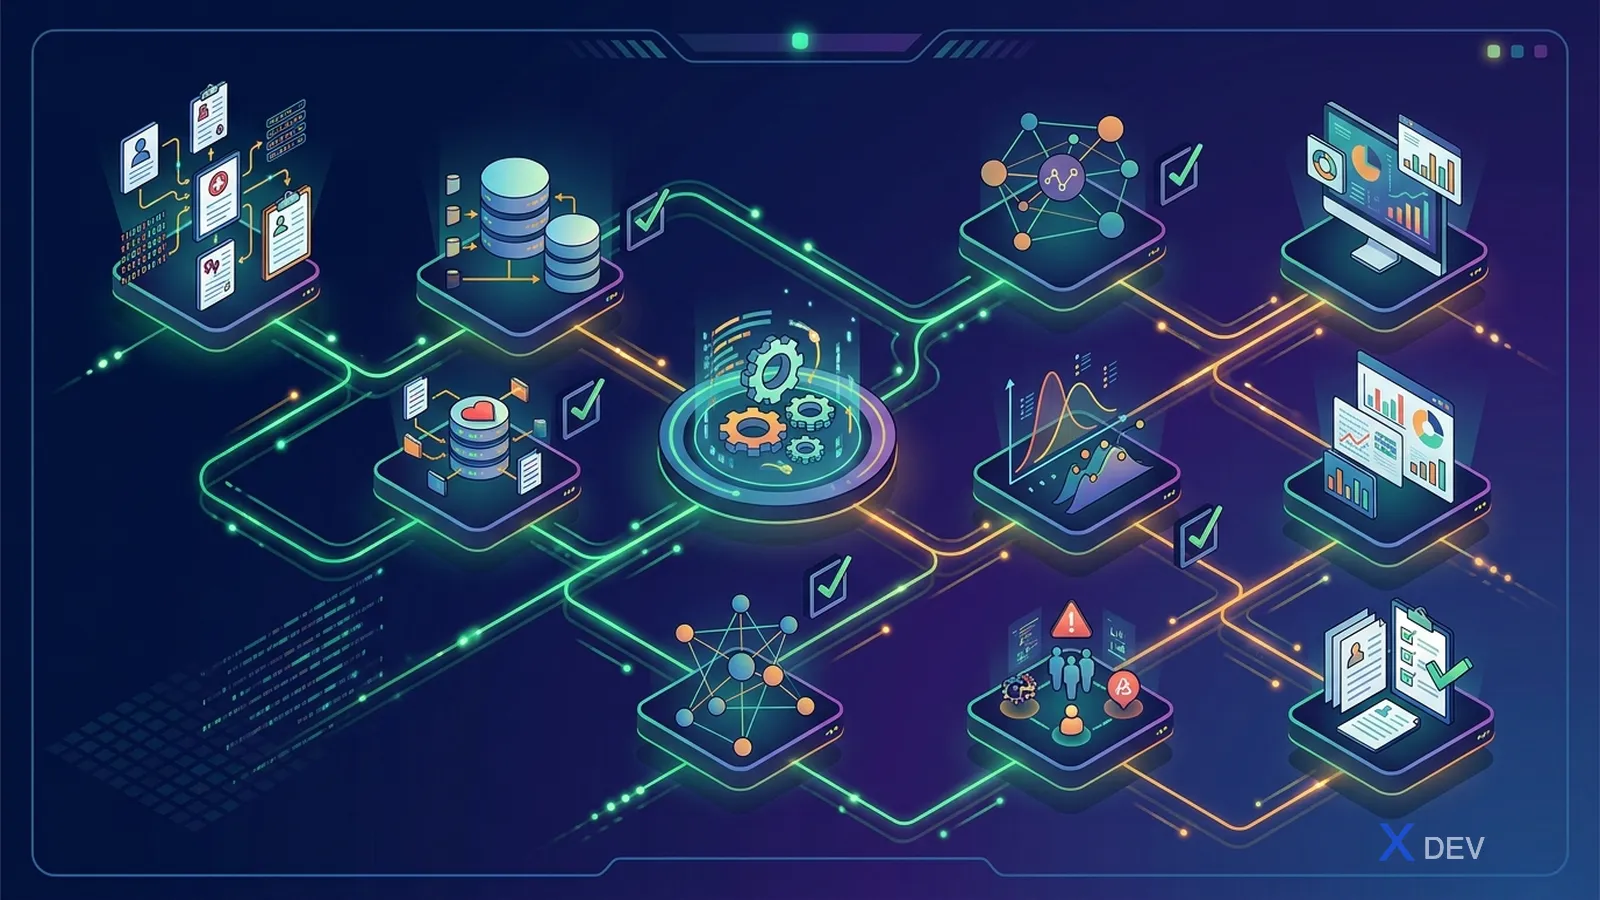
All of it runs in Docker Compose via Broadsea.
2. Broadsea — one-command deployment
git clone https://github.com/OHDSI/Broadsea
cd Broadsea
cp .env.example .env
# Edit .env: Postgres connection, ATLAS port, security
docker compose --profile default up -d

# Access:
# - ATLAS: http://localhost/atlas
# - WebAPI: http://localhost/WebAPI
# - HADES R Studio: http://localhost:8787
Broadsea services:
broadsea-webtools— ATLAS + WebAPIbroadsea-hades— RStudio Server with HADES preinstalledbroadsea-content— Atlas content portalohdsi-postgresql— DB for WebAPI
3. ATLAS
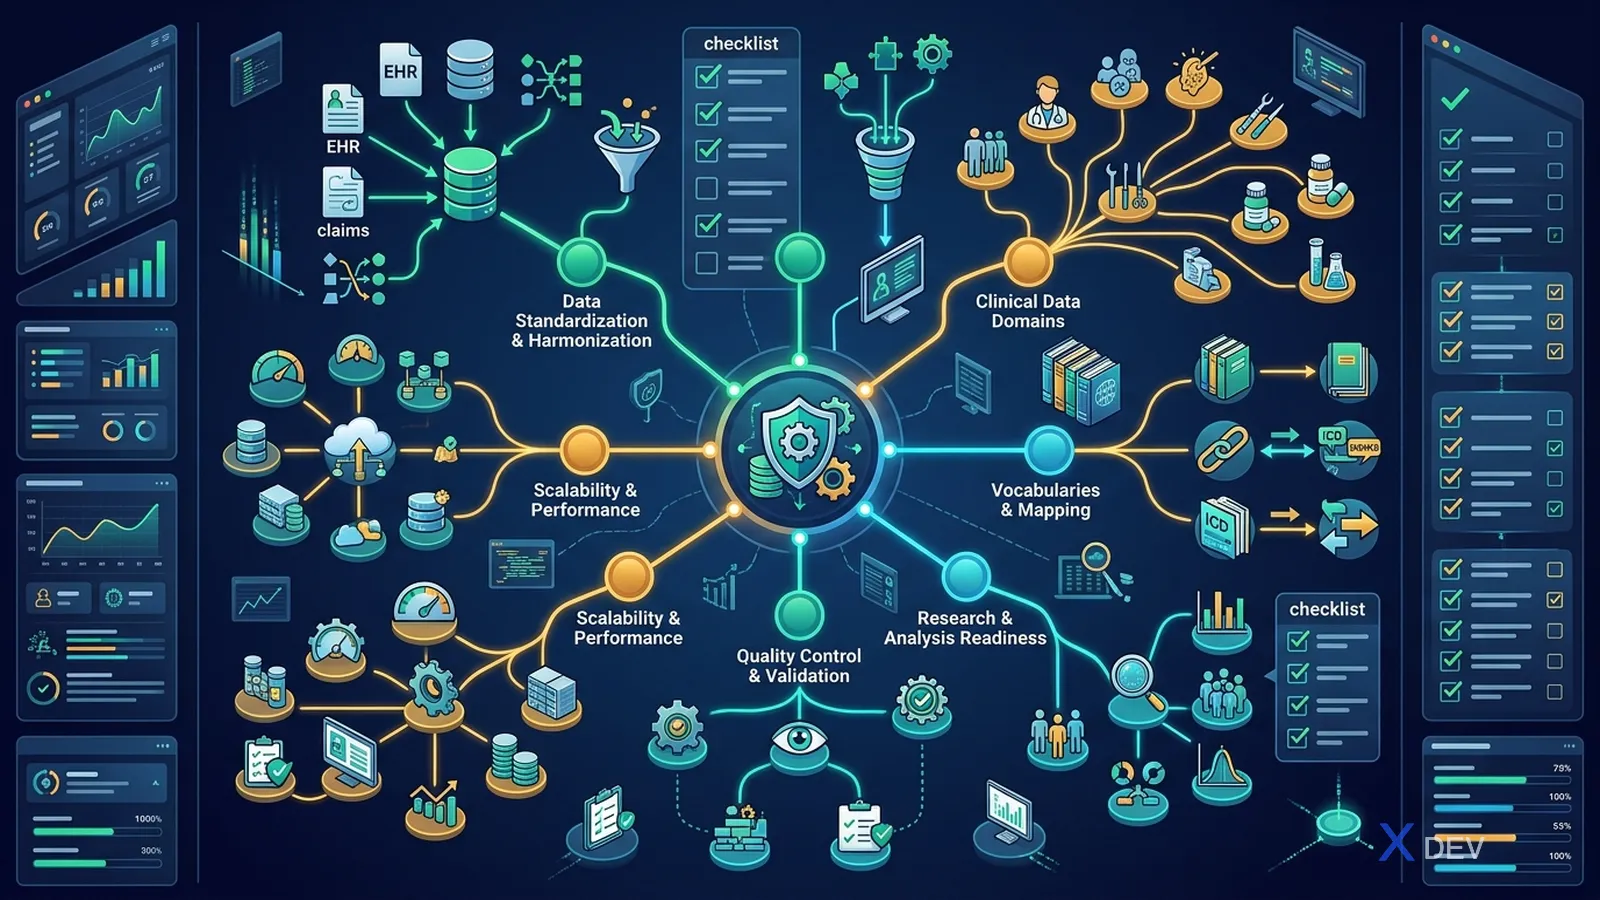
3.1 Key features
3.2 Cohort creation workflow
Example: "Patients newly diagnosed with type 2 diabetes in 2026 who started Metformin"
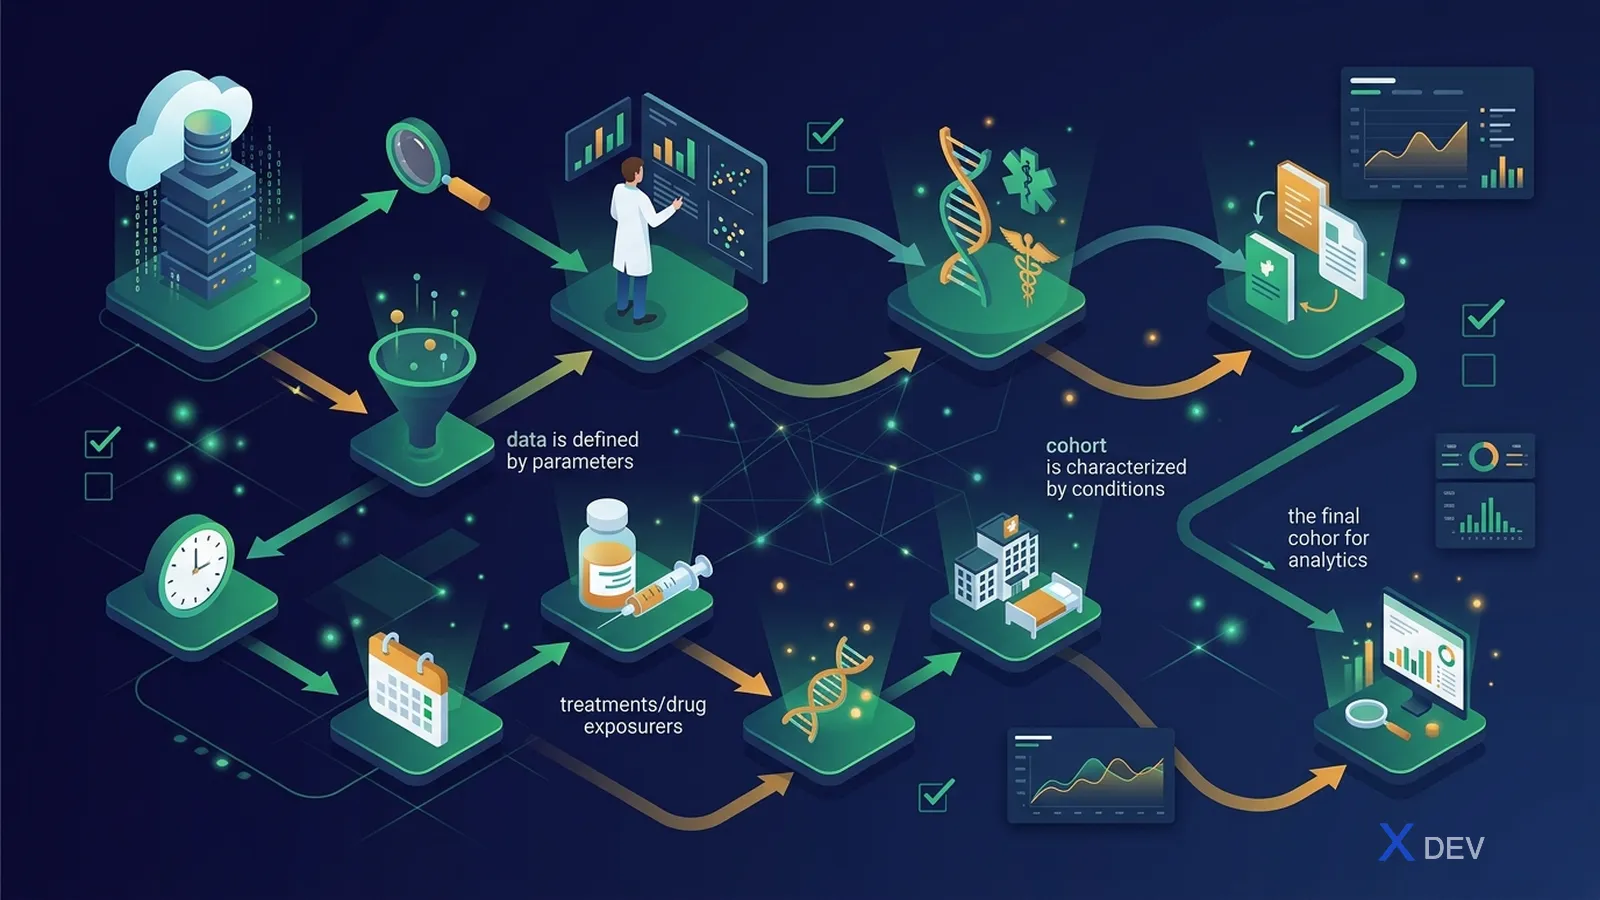
The ATLAS UI lets you click and drag without writing SQL → produces a cohort table that conforms to OMOP.
3.3 Exporting cohort SQL
ATLAS auto-generates standard OHDSI Circe SQL:
-- Generated by Atlas
INSERT INTO cohort (cohort_definition_id, subject_id, cohort_start_date, cohort_end_date)
SELECT 1, person_id, condition_start_date, ...
FROM condition_occurrence co
JOIN concept_ancestor ca ON co.condition_concept_id = ca.descendant_concept_id
WHERE ca.ancestor_concept_id = 201826
  AND condition_start_date >= '2026-01-01'
  ...
→ You can version-control this and run it from the CLI outside ATLAS.
3.4 Characterization
After defining a cohort, run Characterization to describe it:
- % gender, age strata
- Top comorbidities (top 100 conditions in the 365 days before index)
- Top drugs
- Top procedures
- Lab values
→ Outputs tables and forest plots. Especially powerful when comparing two cohorts (e.g. Metformin vs. SGLT2 first-line).
4. ACHILLES
ACHILLES is an R package that profiles every column in the CDM, producing ~170 analysis IDs:
- Number of persons, gender, race, year-of-birth distributions
- Visit counts by type
- Top conditions, drugs, procedures, measurements
- Time series: monthly counts
- Heel: outlier flags (e.g. "year_of_birth = 1850 detected")
library(Achilles)
achilles(
  connectionDetails = connectionDetails,
  cdmDatabaseSchema = "cdm",
  resultsDatabaseSchema = "results",
  vocabDatabaseSchema = "cdm",
  numThreads = 4
)
After running → tables achilles_results, achilles_results_dist, achilles_heel_results.
ATLAS has a "Data Sources" tab that visualizes ACHILLES results — this is the showcase you give researchers when introducing a data partner.
5. Data Quality Dashboard (DQD)
3,000+ rules grouped into the three Kahn categories:
| Category | Description | Example |
|---|---|---|
| Conformance | Data has the right type, format, and value set | gender_concept_id ∈ {0, 8507, 8532} |
| Completeness | Acceptable NULL ratio | < 5% person.year_of_birth NULL |
| Plausibility | Clinically plausible values | HbA1c not > 20% |
5.1 Running DQD
library(DataQualityDashboard)
executeDqChecks(
  connectionDetails = connectionDetails,
  cdmDatabaseSchema = "cdm",
  resultsDatabaseSchema = "results",
  cdmSourceName = "Hospital ABC OMOP CDM",
  outputFolder = "dqd_results",
  cdmVersion = "5.4"
)

# Generate viewer
viewDqDashboard("dqd_results/results.json")
Output:
- An interactive HTML dashboard
- A JSON file with each check + pass/fail/threshold
5.2 Reading DQD
Each check has:
category: conformance / completeness / plausibilitysubcategory: e.g. "valueLow", "valueHigh"level: TABLE / FIELD / CONCEPTseverity: error / warning / notificationpct_records_violating: % violatingthreshold: acceptance thresholdpass/fail
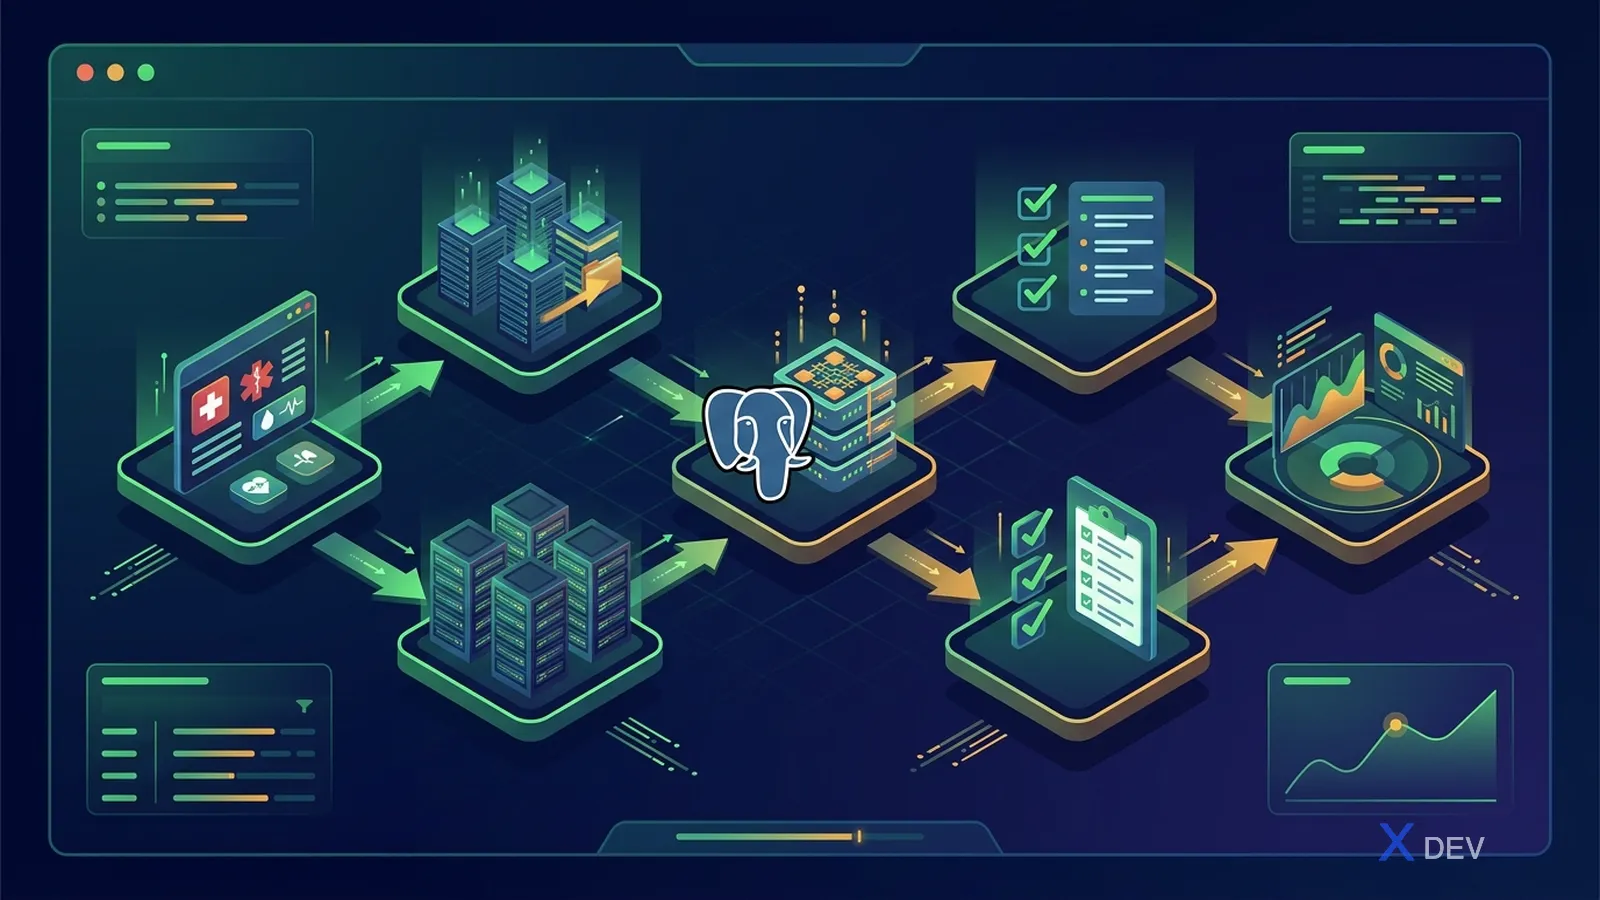
5.3 Triage pattern
When DQD fails:
- Read the check description
- Identify the root cause (source data error vs. ETL error vs. threshold too strict)
- Fix the ETL or raise the threshold (if there is a good reason)
- Re-run DQD
- Document the decision in the ETL spec
5.4 Custom checks
DQD allows you to add your own rules:
# custom_checks.csv
checkName: VN_BHYT_coverage
checkDescription: > 90% of persons should have at least 1 PAYER_PLAN_PERIOD = BHYT
queryText: |
  SELECT (1.0 - SUM(CASE WHEN p.person_id IS NOT NULL THEN 1 ELSE 0 END) / COUNT(*)) AS pct_violation
  FROM person ps
  LEFT JOIN payer_plan_period p ON ps.person_id = p.person_id
    AND p.payer_concept_id = 2000010001  -- VN custom BHYT
threshold: 0.10
severity: warning
6. Integrating DQD into CI/CD
# .github/workflows/dqd.yml
name: OMOP DQ Weekly
on:
  schedule:
    - cron: '0 3 * * 1'  # Monday 3AM
jobs:
  dqd:
    runs-on: self-hosted
    steps:
      - uses: actions/checkout@v4
      - run: Rscript scripts/run_dqd.R
      - name: Upload result
        uses: actions/upload-artifact@v4
        with:
          name: dqd-${{ github.run_id }}
          path: dqd_results/
      - name: Fail on critical errors
        run: |
          jq '.Overview | select(.numFailed > 0)' dqd_results/results.json && exit 1 || exit 0
7. A real-world production stack
| Component | Suggested spec |
|---|---|
| Postgres CDM | 16 vCPU, 64 GB RAM, 2 TB SSD, partitioned by year |
| WebAPI | 4 vCPU, 8 GB RAM, JVM heap 4 GB |
| ATLAS Web | 2 vCPU, 4 GB RAM (static only) |
| ACHILLES | 8 vCPU, 16 GB RAM, 4-12h runtime for a 10M-person dataset |
| DQD | 8 vCPU, 16 GB RAM, 2-6h depending on rule scope |
| HADES R Studio | 16 vCPU, 32 GB RAM for PLP training |
Backups: nightly CDM snapshots, weekly ACHILLES results.
8. ATLAS security
ATLAS has no auth by default → DO NOT deploy it publicly without protection. Setup:
- LDAP / AD integration via WebAPI
- HTTPS via a reverse proxy (NGINX)
- Audit log every cohort generation
- Row-level security for sensitive data partners
9. Multi-tenant pattern
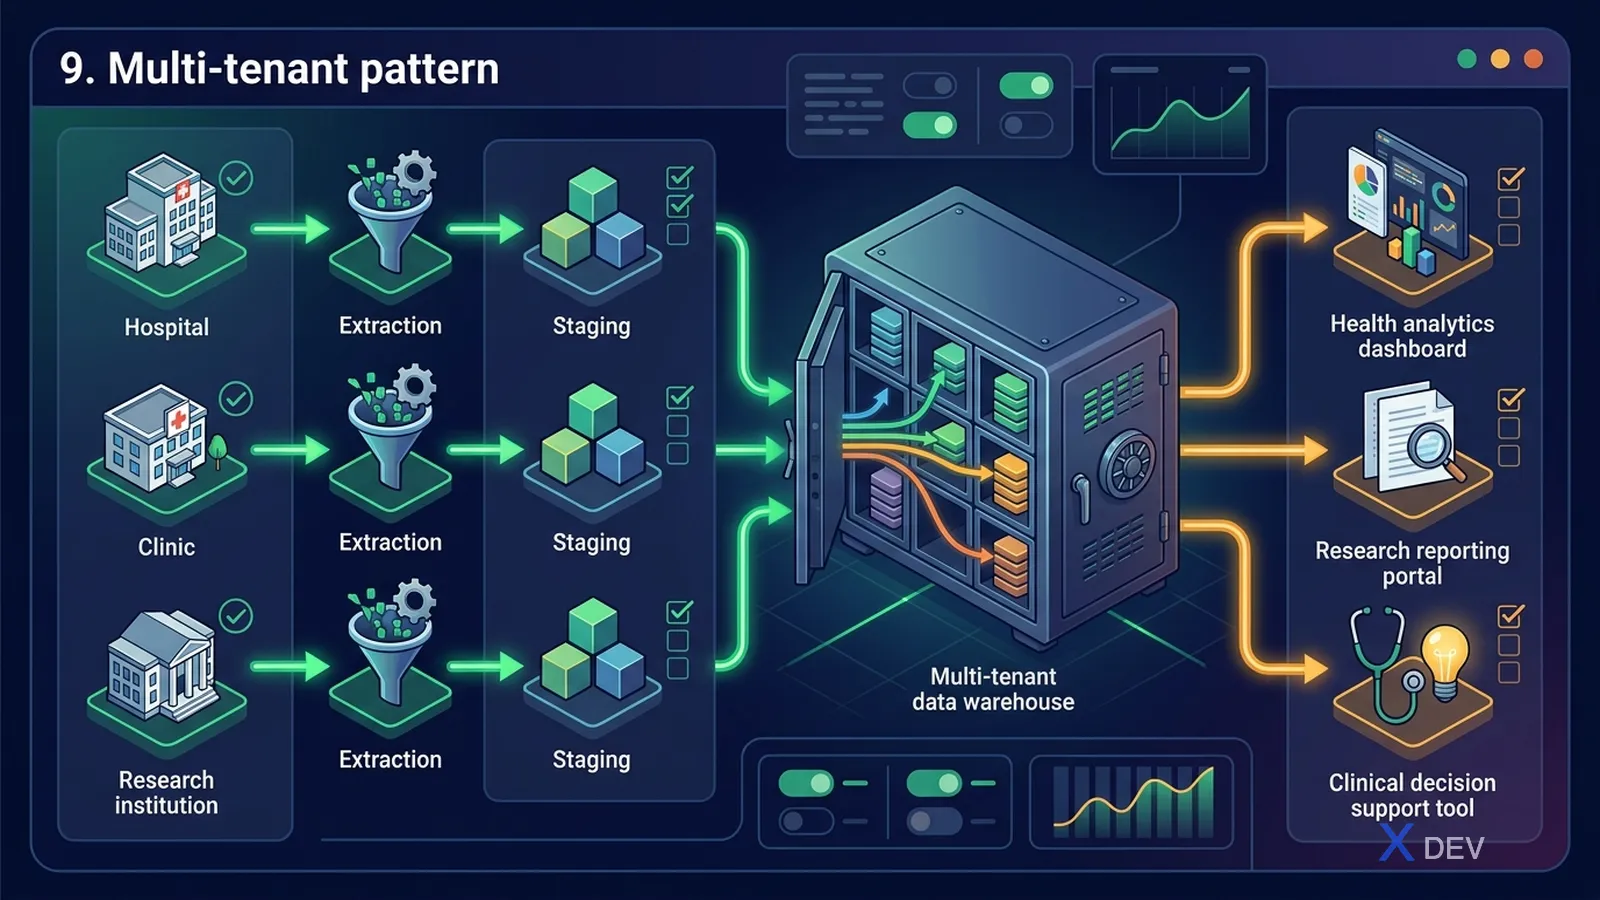
WebAPI supports multiple sources — researchers pick a source from a dropdown. Permissions are per user / per source.
10. Network deployment for Vietnam
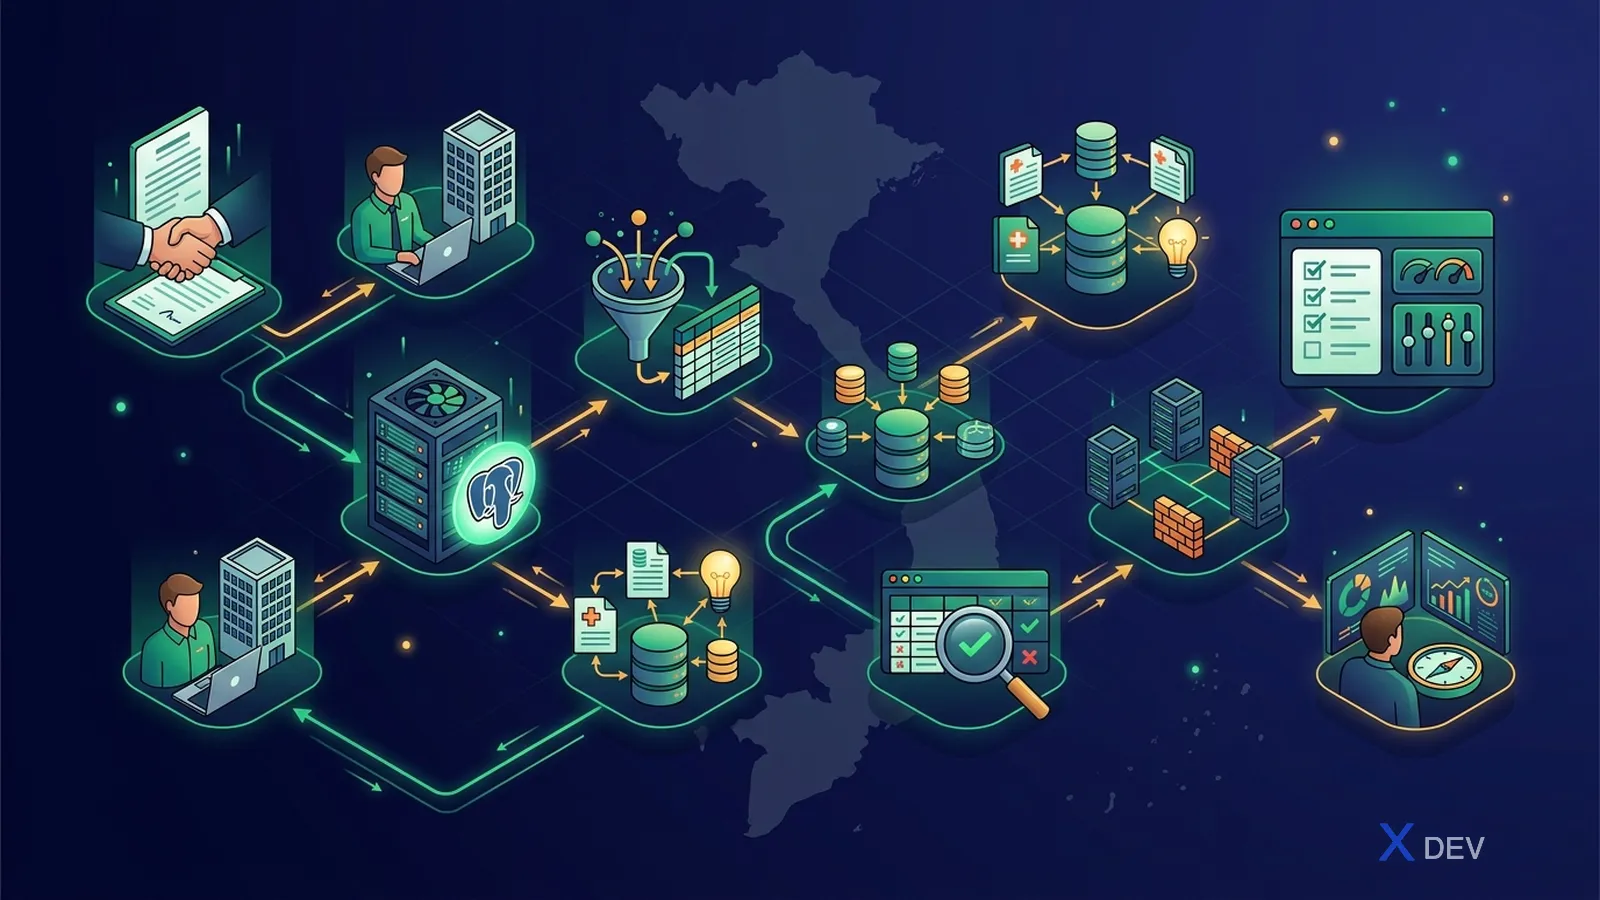
Federated pattern: data stays at the hospital, only aggregate results travel up.
11. Pitfalls
- ❌ Cohort skips
concept_ancestor→ misses disease variants - ❌ Generating cohorts without checking inclusion-rule overlap → duplicates
- ❌ Ignoring DQD warnings → analytics get rejected at peer review
- ❌ Forgetting to re-run ACHILLES after an ETL refresh → ATLAS shows stale numbers
- ❌ Public ATLAS without auth → leaks patient metadata
- ❌ Forgetting to back up
webapi.cohort_definition→ loses cohort definitions
Conclusion
ATLAS + DQD + ACHILLES are the three pillars of OMOP operations. Broadsea makes deployment a single command. Investing in DQ gates in CI/CD from day one saves a huge amount of pain when you start publishing research.
Next article: HADES Analytics — PLE, PLP, Characterization with R.