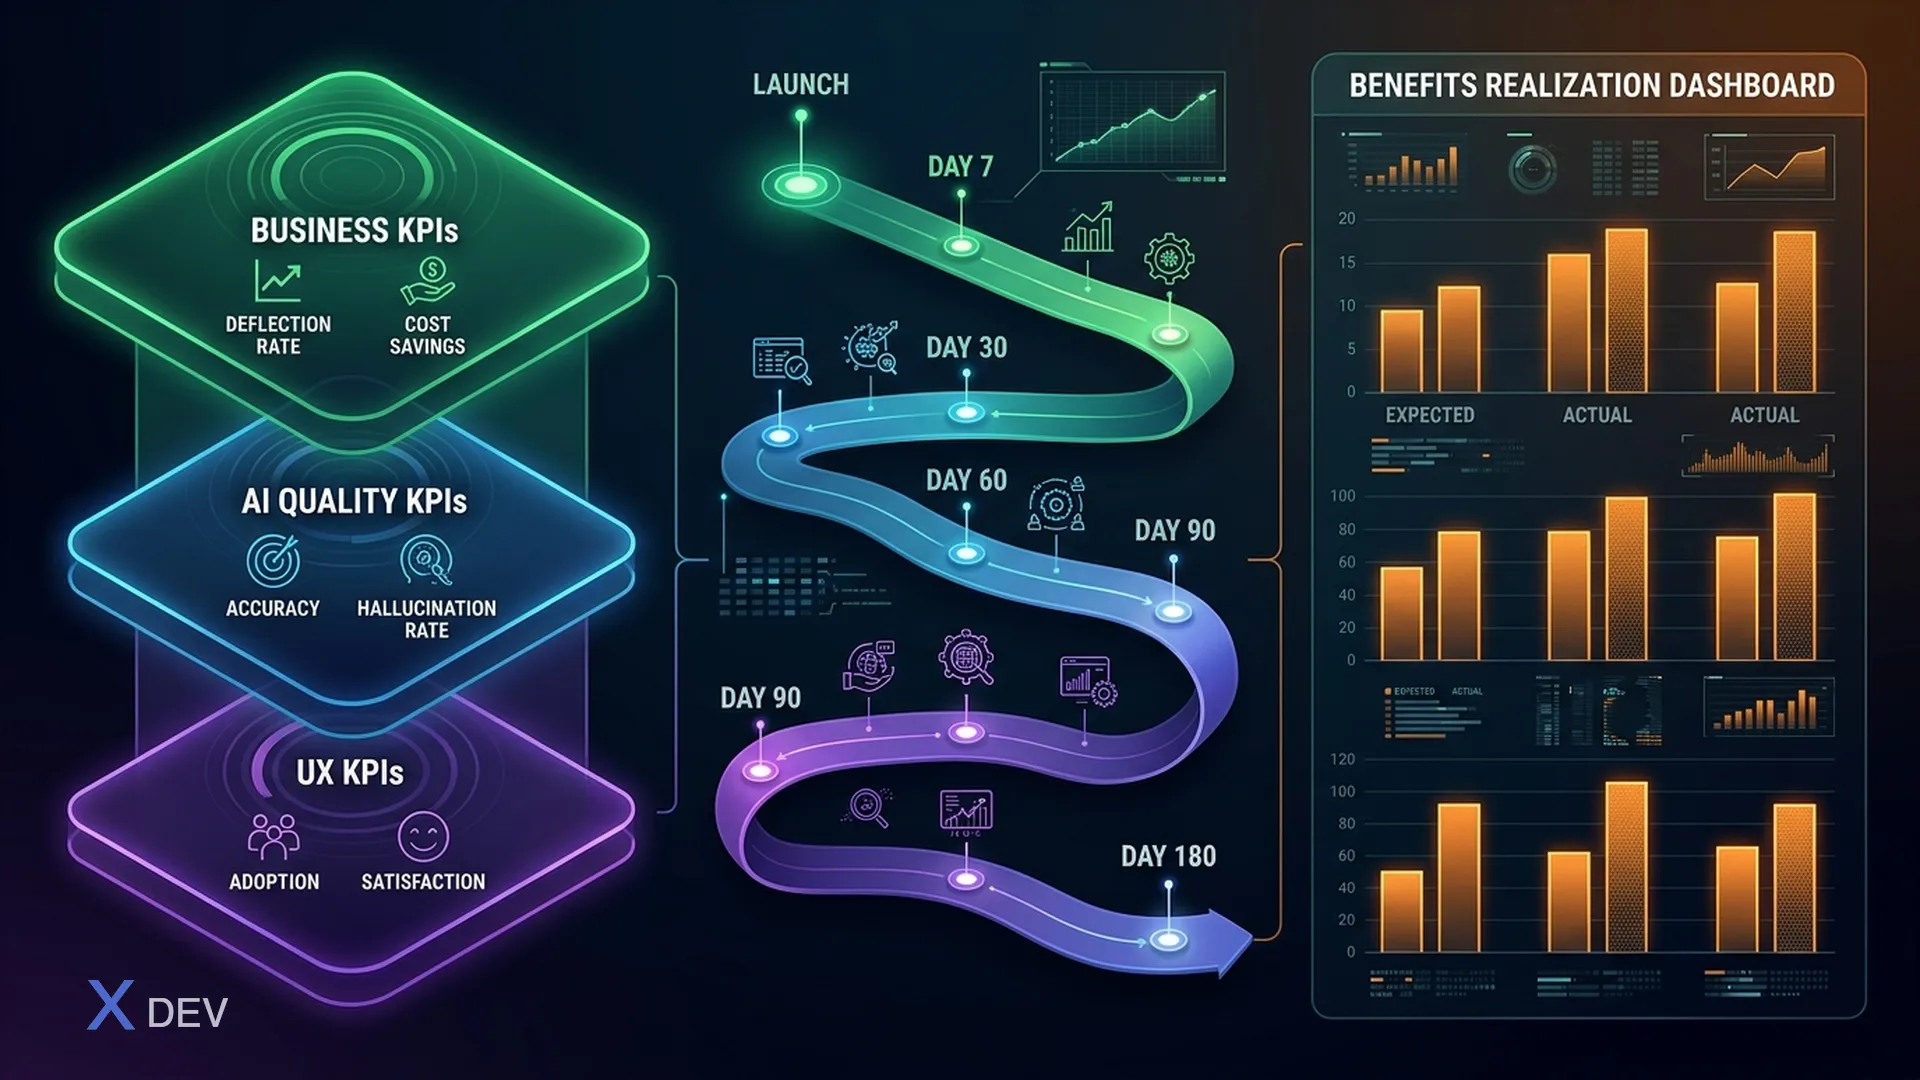
"Feature launched. Now what?" — This question usually comes weeks later with no answer. Why: evaluation framework wasn't designed beforehand.
Good BA defines success before building, not after launch.
1. Why AI Features Need Special Evaluation
Traditional features: Transactions processed, time spent, error rate — straightforward metrics.
AI features add:
- Output quality drift: Model can degrade if data distribution changes
- User trust decay: Users stop using AI if it fails a few times
- Hallucination incidents: Need monitoring beyond error rates
- Cost scaling: More users = exponential cost, not linear
2. Three KPI Layers for AI Feature
Layer 1: Business KPIs
Why the feature was built — must measure business value:
| KPI | Example (AI Chatbot) | Target |
|---|---|---|
| Deflection rate | % questions AI handles without agent | ≥ 60% by day 30 |
| Resolution rate | % users satisfied after AI response | ≥ 70% |
| Cost per resolution | Cost to process 1 request (API + infra) vs. agent | < $0.5 |
| Time to resolution | Avg time from question to answer | < 30 seconds |
| NPS | Net Promoter Score for feature | ≥ +10 vs. baseline |
Layer 2: Technical / AI Quality KPIs
Measure AI output quality, not just uptime:
| KPI | How Measured | Threshold |
|---|---|---|
| Accuracy | Sampling + human review (5% traffic) | ≥ 85% |
| Hallucination rate | Fact-check sampling | ≤ 2% |
| Confidence distribution | % responses with score < threshold | Monitor weekly |
| Escalation rate | % requests escalate to human | 10–30% (domain-dependent) |
| Latency p95 | 95th percentile response time | < 3 seconds |
| Error rate | API errors, timeouts | < 0.5% |
Layer 3: User Experience KPIs
Measure actual experience, not just technical metrics:
| KPI | How Collected | Target |
|---|---|---|
| Task completion rate | Analytics tracking | ≥ 75% |
| Re-query rate | User asks again within 5 min | ≤ 15% |
| Abandonment rate | User exits mid-interaction | ≤ 20% |
| Thumb up/down rate | In-app feedback | ≥ 60% positive |
| Feature adoption | MAU using AI feature / total MAU | ≥ 40% by day 60 |
3. Evaluation Timeline: 30/60/90/180 Days
LAUNCH
  │
  ├── Day 7 (Health check)
  │   - Normal error rate?
  │   - Any incidents to fix?
  │   - Early user feedback
  │
  ├── Day 30 (Initial assessment)
  │   - Compare KPIs vs. pre-launch baseline
  │   - Accuracy sampling (100 cases)
  │   - Identify top failure modes
  │
  ├── Day 60 (Optimization)
  │   - Full KPI review
  │   - A/B test results (if any)
  │   - Prompt tuning if accuracy below target
  │   - Decision: scale up / hold / pivot
  │
  ├── Day 90 (Milestone review)
  │   - Business impact report for stakeholders
  │   - ROI calculation
  │   - Q2 roadmap based on learnings
  │
  └── Day 180 (Benefits realization review)
      - Compare to original business case
      - Decision: continue / scale / retire
4. Benefits Realization Tracking
Track whether original business case is actually being realized:
## Benefits Realization Report: [Feature] — 90 days

### Business Case Summary (Pre-launch)
- Expected benefit: Reduce agent workload 40%
- Expected cost: $X/month API cost
- Expected ROI: [N] months payback

### Actual Results
| Benefit | Expected | Actual (D90) | Status |
|---------|---------|-------------|--------|
| Deflection rate | 60% | 52% | ⚠️ Below |
| Agent hours saved | 200h/month | 160h/month | ⚠️ Below |
| User satisfaction | 70% | 74% | ✅ Above |
| Monthly API cost | $500 | $620 | ⚠️ Over |

### Root Cause Analysis
- Lower deflection: long-tail queries (30% of traffic) AI can't handle
- Cost over budget: user volume +25% vs. estimate

### Recommended Actions
1. Expand knowledge base for top 20 unanswered queries
2. Implement cost cap and usage tiering
3. Revised D180 target: deflection ≥ 58%
5. Dashboard BA Should Request from Data Team
Request BEFORE launch, not after. Don't build post-launch.
REAL-TIME MONITORING (Operational)
☐ Error rate, uptime, latency (Engineering)
☐ Escalation rate (daily)
☐ Cost per day / per request (FinOps)

WEEKLY REVIEW
☐ Accuracy trend (sampling)
☐ Top failed query types
☐ User satisfaction scores

MONTHLY REPORT
☐ Full KPI dashboard vs. targets
☐ A/B test results
☐ Feature adoption funnel
☐ Cost vs. benefit summary
6. When KPIs Miss: Decision Framework
| Situation | Action |
|---|---|
| Accuracy < threshold | Tune prompts → if no improvement → retrain |
| Low user adoption | User research → usually UX issue, not AI |
| Cost over budget | Model tiering (cheaper model for simple cases) |
| High escalation | Expand AI coverage OR optimize agent workflow |
| Hallucination incidents | Add RAG or fact-check layer |
| Business KPI miss | Revisit original business case assumptions |
Summary
Solution evaluation is not Data Analyst or PM's job — BA owns defining KPIs and ensuring data exists to measure them. If not built into spec, nobody builds it.
Key practice: Before sprint 1, add "Success Metrics" section to SRS with specific KPIs, thresholds, measurement method, and owner. This is a commitment to business, not an afterthought.