はじめに
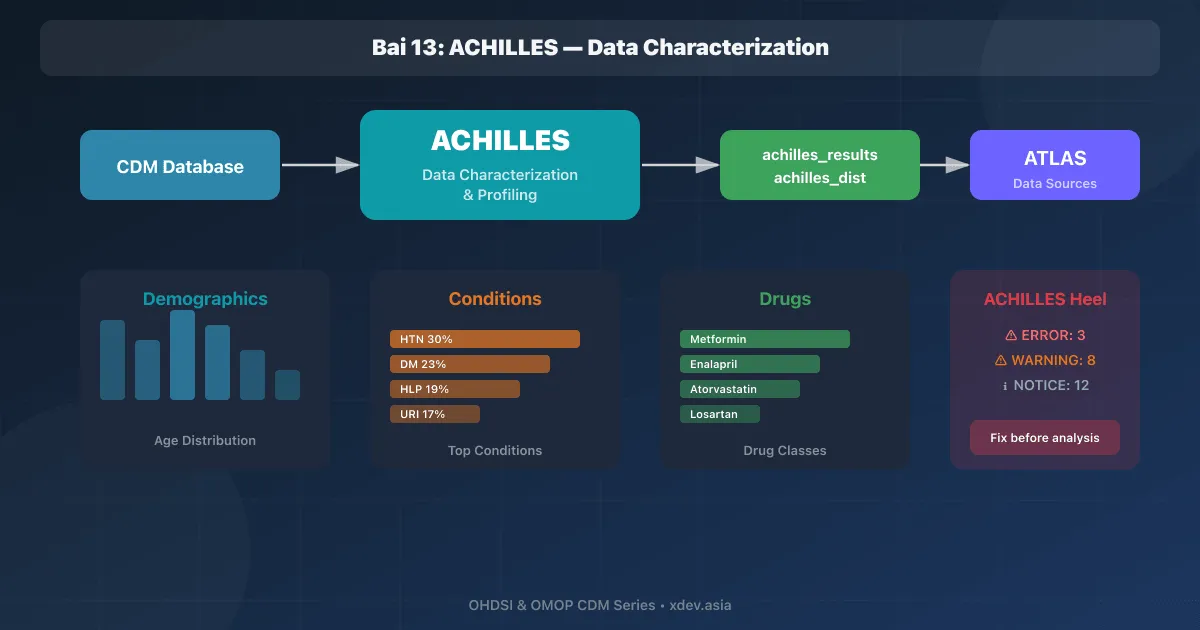
ACHILLES (大規模長期的証拠システムにおける医療情報の自動特性評価) は、CDM データベースの 記述統計 を作成するツールです。 ACHILLES の結果は ATLAS データ ソースに表示され、分析前にデータを理解するのに役立ちます。
Vai trò ACHILLES trong workflow:

ETL → CDM Database → ┬→ ACHILLES ─→ Data Sources (ATLAS)
                      │              "Dữ liệu trông thế nào?"
                      │
                      ├→ DQD ──────→ Data Quality Report
                      │              "Dữ liệu có đúng không?"
                      │
                      └→ Analysis ─→ Cohort, Estimation, Prediction
                                     "Dữ liệu nói gì?"
1. ACHILLESをインストールする
1.1 要件
- R ≥ 4.0
- Java Runtime (cho DatabaseConnector / JDBC)
- CDM database đã có data
- WebAPI đã cấu hình source
1.2 R パッケージのインストール
# Cài từ GitHub
install.packages("remotes")
remotes::install_github("OHDSI/Achilles")

# Dependencies sẽ tự cài:
#   DatabaseConnector, SqlRender, ParallelLogger
1.3 接続の構成
library(Achilles)
library(DatabaseConnector)

connectionDetails <- createConnectionDetails(
  dbms = "postgresql",
  server = "localhost/ohdsi",
  user = "ohdsi_app",
  password = keyring::key_get("ohdsi_password"),
  port = 5432
)

# Kiểm tra kết nối
conn <- connect(connectionDetails)
querySql(conn, "SELECT COUNT(*) FROM cdm.person")
disconnect(conn)
2. アキレスを実行します。
2.1 フルラン
achilles(
  connectionDetails = connectionDetails,
  cdmDatabaseSchema = "cdm",
  resultsDatabaseSchema = "results",
  vocabDatabaseSchema = "cdm",
  sourceName = "Hospital_VN_2024",
  cdmVersion = "5.4",
  createTable = TRUE,
  smallCellCount = 5,          # ẩn cell < 5 (privacy)
  numThreads = 4,
  tempEmulationSchema = NULL
)
2.2 ACHILLES テーブルの作成
-- ACHILLES tạo 2 bảng chính trong results schema:

-- 1. achilles_results: aggregate statistics
SELECT * FROM results.achilles_results LIMIT 5;

-- analysis_id  | stratum_1   | stratum_2 | count_value
-- 1            | NULL        | NULL      | 150000      ← tổng patients
-- 2            | NULL        | NULL      | 2500000     ← tổng visits
-- 101          | 8507        | NULL      | 78000       ← male count
-- 101          | 8532        | NULL      | 72000       ← female count
-- 200          | 201826      | NULL      | 45000       ← Type 2 DM count

-- 2. achilles_results_dist: distribution statistics
SELECT * FROM results.achilles_results_dist LIMIT 3;

-- analysis_id | stratum_1 | min  | p10  | p25  | median | p75  | p90  | max
-- 103         | NULL      | 0    | 12   | 25   | 45     | 62   | 78   | 105  ← age dist
-- 203         | 201826    | 1    | 10   | 30   | 90     | 180  | 365  | 3650 ← DM duration
2.3 重要な ID を分析する
Analysis ID  | Mô tả
─────────────┼─────────────────────────────────────────
1            | Number of persons
2            | Number of visits
101          | Gender distribution
103          | Age at first obs distribution
108          | Obs period length distribution
200          | Condition occurrence counts by concept
400          | Condition era counts
700          | Drug exposure counts by concept
800          | Observation counts
1800         | Measurement counts by concept
2100         | Procedure counts by concept
3. ATLAS の ACHILLES レポート
3.1 データソースのアクティブ化
Sau khi chạy ACHILLES:
1. WebAPI tự đọc bảng achilles_results
2. ATLAS → Data Sources → chọn source

Nếu chưa thấy:
  WebAPI → source config → achillesResultsSchema = "results"
  Refresh WebAPI cache
3.2 概要ダッシュボード
ATLAS → Data Sources → Hospital_VN_2024

┌─────────────────────────────────────────────────────────┐
│  Hospital_VN_2024 — Data Source Report                  │
│                                                         │
│  Persons:      150,000                                  │
│  Records:      12,500,000                               │
│  Obs Period:   2015-01-01 → 2024-12-31                  │
│                                                         │
│  Tabs:                                                  │
│  [Dashboard] [Conditions] [Drugs] [Procedures]          │
│  [Measurements] [Observations] [Visits] [Death]         │
│                                                         │
│  Gender:                                                │
│  ████████████████ Male (52%)                            │
│  ██████████████   Female (48%)                          │
│                                                         │
│  Age Distribution:                                      │
│  0-9:  ██ 8%                                            │
│  10-19: ███ 12%                                         │
│  20-29: █████ 15%                                       │
│  30-39: ██████ 18%                                      │
│  40-49: ████████ 20%                                    │
│  50-59: ██████ 16%                                      │
│  60-69: ███ 7%                                          │
│  70+:   ██ 4%                                           │
└─────────────────────────────────────────────────────────┘
3.3 状態レポート
ATLAS → Data Sources → Conditions

Top 20 Conditions:
┌────┬──────────────────────────────────┬─────────┬────────┐
│ #  │ Condition                        │ Persons │ %      │
├────┼──────────────────────────────────┼─────────┼────────┤
│  1 │ Essential hypertension           │ 45,000  │ 30.0%  │
│  2 │ Type 2 diabetes mellitus         │ 35,000  │ 23.3%  │
│  3 │ Hyperlipidemia                   │ 28,000  │ 18.7%  │
│  4 │ Upper respiratory infection      │ 25,000  │ 16.7%  │
│  5 │ Osteoarthritis                   │ 18,000  │ 12.0%  │
│  6 │ Chronic kidney disease           │ 12,000  │  8.0%  │
│  7 │ Ischemic heart disease           │ 10,000  │  6.7%  │
│  8 │ Depression                       │  8,500  │  5.7%  │
└────┴──────────────────────────────────┴─────────┴────────┘

Drill-down per condition:
  - Prevalence by month (trend over time)
  - Age at first diagnosis distribution
  - Type (inpatient / outpatient / ER)
  - Frequency distribution per person
3.4 薬物報告
ATLAS → Data Sources → Drugs

Drug Exposure by Class (ATC):
┌──────────────────────────────────────────────────┐
│  A10 — Drugs for diabetes                        │
│  ├── Metformin:       25,000 persons             │
│  ├── Glimepiride:      8,000 persons             │
│  ├── Insulin Glargine: 5,000 persons             │
│  └── Empagliflozin:    3,000 persons             │
│                                                  │
│  C09 — ACE Inhibitors & ARBs                     │
│  ├── Enalapril:       15,000 persons             │
│  ├── Losartan:        12,000 persons             │
│  └── Valsartan:        8,000 persons             │
│                                                  │
│  C10 — Lipid Lowering Agents                     │
│  ├── Atorvastatin:    20,000 persons             │
│  ├── Rosuvastatin:    10,000 persons             │
│  └── Simvastatin:      5,000 persons             │
└──────────────────────────────────────────────────┘

Duration distribution, frequency, dosage patterns
##4.アキレス腱
4.1 データ品質に関する警告
# ACHILLES Heel chạy tự động cùng achilles()
# Kết quả lưu trong bảng achilles_heel_results

# Xem warnings:
conn <- connect(connectionDetails)
heel <- querySql(conn, "
  SELECT *
  FROM results.achilles_heel_results
  ORDER BY record_count DESC
  LIMIT 20
")
disconnect(conn)
4.2 ヒール警告の例
┌─────┬──────────────────────────────────────────────┬──────────┐
│ ID  │ Warning Message                              │ Severity │
├─────┼──────────────────────────────────────────────┼──────────┤
│   1 │ 5,200 records with date before 1900          │ ERROR    │
│   2 │ 800 persons with age > 150 years             │ ERROR    │
│   3 │ Condition_occurrence has 12% unmapped codes  │ WARNING  │
│   4 │ Drug_exposure end_date < start_date (350)    │ ERROR    │
│   5 │ 15% persons with observation < 30 days       │ WARNING  │
│   6 │ Measurement has no unit_concept_id (25%)     │ WARNING  │
│   7 │ Visit_occurrence has 0 ER visits             │ NOTICE   │
│   8 │ Death records only from 2020+ (COVID bias?)  │ NOTICE   │
└─────┴──────────────────────────────────────────────┴──────────┘

Severity levels:
  ERROR:   Lỗi nghiêm trọng cần fix trước khi phân tích
  WARNING: Vấn đề nên xử lý nhưng không block
  NOTICE:  Thông tin cần kiểm tra
4.3 かかとの警告への対処
-- Fix ERROR #1: Records with date before 1900
UPDATE cdm.condition_occurrence
SET condition_start_date = NULL
WHERE condition_start_date < '1900-01-01';

-- Fix ERROR #2: Age > 150
DELETE FROM cdm.person
WHERE EXTRACT(YEAR FROM CURRENT_DATE) - year_of_birth > 150;

-- Fix ERROR #4: end_date < start_date
UPDATE cdm.drug_exposure
SET drug_exposure_end_date = drug_exposure_start_date
WHERE drug_exposure_end_date < drug_exposure_start_date;

-- Sau khi fix: chạy lại ACHILLES
5. インクリメンタルモード
5.1 ACHILLES をより速く実行する
# Lần đầu: full run (~2-4 giờ cho 1M patients)
# Lần sau: incremental (chỉ update thay đổi)

achilles(
  connectionDetails = connectionDetails,
  cdmDatabaseSchema = "cdm",
  resultsDatabaseSchema = "results",
  sourceName = "Hospital_VN_2024",
  cdmVersion = "5.4",
  createTable = FALSE,       # không tạo lại bảng
  updateGivenAnalysesOnly = TRUE,
  analysisIds = c(1, 101, 200, 700, 1800)  # chỉ update analyses cần
)
5.2 cron による自動化
#!/bin/bash
# /opt/ohdsi/scripts/run_achilles.sh

cd /opt/ohdsi/achilles
Rscript -e '
library(Achilles)
library(DatabaseConnector)

connectionDetails <- createConnectionDetails(
  dbms = "postgresql",
  server = Sys.getenv("CDM_DB_SERVER"),
  user = Sys.getenv("CDM_DB_USER"),
  password = Sys.getenv("CDM_DB_PASS"),
  port = 5432
)

achilles(
  connectionDetails = connectionDetails,
  cdmDatabaseSchema = "cdm",
  resultsDatabaseSchema = "results",
  sourceName = "Hospital_VN_2024",
  cdmVersion = "5.4",
  numThreads = 4
)

cat("ACHILLES completed:", format(Sys.time()), "\n")
'
# Chạy ACHILLES hàng tuần (Chủ nhật 2:00 AM)
0 2 * * 0 /opt/ohdsi/scripts/run_achilles.sh >> /var/log/achilles.log 2>&1
概要
| 成分 | 機能 |
|---|---|
| アキレスコア | CDM データベースの集計統計を計算する |
| アキレス結果 | 表には、カウント、有病率、 |
| アキレス結果距離 | 分布を含む表 (p10、p25、中央値...) |
| アキレスヒール | データ品質の問題の検出 (エラー/警告/通知) |
| ATLAS データ ソース | ACHILLESの結果をダッシュボード形式で表示 |
| インクリメンタルモード | 高速に実行 - 変更のみを更新 |
次の記事: データ品質ダッシュボード — CDM データ品質の評価