Giới thiệu
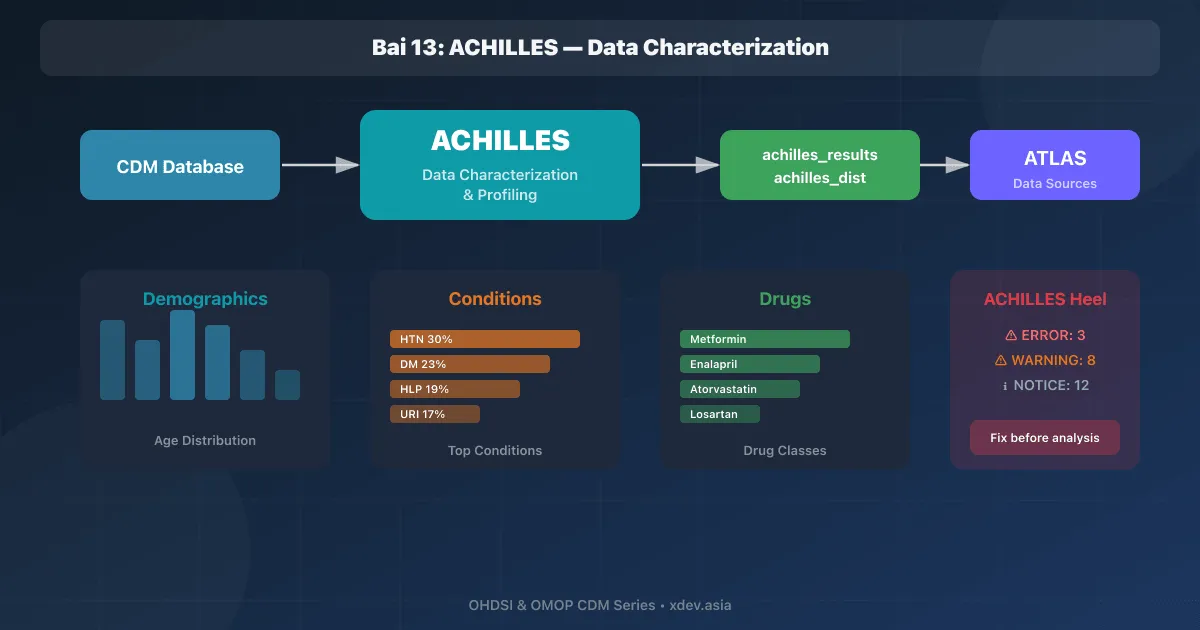
ACHILLES (Automated Characterization of Health Information at Large-scale Longitudinal Evidence Systems) là công cụ tạo descriptive statistics cho CDM database. Kết quả ACHILLES được hiển thị trong ATLAS Data Sources, giúp hiểu dữ liệu trước khi phân tích.
Vai trò ACHILLES trong workflow:

ETL → CDM Database → ┬→ ACHILLES ─→ Data Sources (ATLAS)
                      │              "Dữ liệu trông thế nào?"
                      │
                      ├→ DQD ──────→ Data Quality Report
                      │              "Dữ liệu có đúng không?"
                      │
                      └→ Analysis ─→ Cohort, Estimation, Prediction
                                     "Dữ liệu nói gì?"
1. Cài đặt ACHILLES
1.1 Yêu cầu
- R ≥ 4.0
- Java Runtime (cho DatabaseConnector / JDBC)
- CDM database đã có data
- WebAPI đã cấu hình source
1.2 Cài đặt R Package
# Cài từ GitHub
install.packages("remotes")
remotes::install_github("OHDSI/Achilles")

# Dependencies sẽ tự cài:
#   DatabaseConnector, SqlRender, ParallelLogger
1.3 Cấu hình Connection
library(Achilles)
library(DatabaseConnector)

connectionDetails <- createConnectionDetails(
  dbms = "postgresql",
  server = "localhost/ohdsi",
  user = "ohdsi_app",
  password = keyring::key_get("ohdsi_password"),
  port = 5432
)

# Kiểm tra kết nối
conn <- connect(connectionDetails)
querySql(conn, "SELECT COUNT(*) FROM cdm.person")
disconnect(conn)
2. Chạy ACHILLES
2.1 Full Run
achilles(
  connectionDetails = connectionDetails,
  cdmDatabaseSchema = "cdm",
  resultsDatabaseSchema = "results",
  vocabDatabaseSchema = "cdm",
  sourceName = "Hospital_VN_2024",
  cdmVersion = "5.4",
  createTable = TRUE,
  smallCellCount = 5,          # ẩn cell < 5 (privacy)
  numThreads = 4,
  tempEmulationSchema = NULL
)
2.2 Các bảng ACHILLES tạo ra
-- ACHILLES tạo 2 bảng chính trong results schema:

-- 1. achilles_results: aggregate statistics
SELECT * FROM results.achilles_results LIMIT 5;

-- analysis_id  | stratum_1   | stratum_2 | count_value
-- 1            | NULL        | NULL      | 150000      ← tổng patients
-- 2            | NULL        | NULL      | 2500000     ← tổng visits
-- 101          | 8507        | NULL      | 78000       ← male count
-- 101          | 8532        | NULL      | 72000       ← female count
-- 200          | 201826      | NULL      | 45000       ← Type 2 DM count

-- 2. achilles_results_dist: distribution statistics
SELECT * FROM results.achilles_results_dist LIMIT 3;

-- analysis_id | stratum_1 | min  | p10  | p25  | median | p75  | p90  | max
-- 103         | NULL      | 0    | 12   | 25   | 45     | 62   | 78   | 105  ← age dist
-- 203         | 201826    | 1    | 10   | 30   | 90     | 180  | 365  | 3650 ← DM duration
2.3 Analysis IDs quan trọng
Analysis ID  | Mô tả
─────────────┼─────────────────────────────────────────
1            | Number of persons
2            | Number of visits
101          | Gender distribution
103          | Age at first obs distribution
108          | Obs period length distribution
200          | Condition occurrence counts by concept
400          | Condition era counts
700          | Drug exposure counts by concept
800          | Observation counts
1800         | Measurement counts by concept
2100         | Procedure counts by concept
3. ACHILLES Reports trong ATLAS
3.1 Kích hoạt Data Sources
Sau khi chạy ACHILLES:
1. WebAPI tự đọc bảng achilles_results
2. ATLAS → Data Sources → chọn source

Nếu chưa thấy:
  WebAPI → source config → achillesResultsSchema = "results"
  Refresh WebAPI cache
3.2 Dashboard tổng quan
ATLAS → Data Sources → Hospital_VN_2024

┌─────────────────────────────────────────────────────────┐
│  Hospital_VN_2024 — Data Source Report                  │
│                                                         │
│  Persons:      150,000                                  │
│  Records:      12,500,000                               │
│  Obs Period:   2015-01-01 → 2024-12-31                  │
│                                                         │
│  Tabs:                                                  │
│  [Dashboard] [Conditions] [Drugs] [Procedures]          │
│  [Measurements] [Observations] [Visits] [Death]         │
│                                                         │
│  Gender:                                                │
│  ████████████████ Male (52%)                            │
│  ██████████████   Female (48%)                          │
│                                                         │
│  Age Distribution:                                      │
│  0-9:  ██ 8%                                            │
│  10-19: ███ 12%                                         │
│  20-29: █████ 15%                                       │
│  30-39: ██████ 18%                                      │
│  40-49: ████████ 20%                                    │
│  50-59: ██████ 16%                                      │
│  60-69: ███ 7%                                          │
│  70+:   ██ 4%                                           │
└─────────────────────────────────────────────────────────┘
3.3 Condition Reports
ATLAS → Data Sources → Conditions

Top 20 Conditions:
┌────┬──────────────────────────────────┬─────────┬────────┐
│ #  │ Condition                        │ Persons │ %      │
├────┼──────────────────────────────────┼─────────┼────────┤
│  1 │ Essential hypertension           │ 45,000  │ 30.0%  │
│  2 │ Type 2 diabetes mellitus         │ 35,000  │ 23.3%  │
│  3 │ Hyperlipidemia                   │ 28,000  │ 18.7%  │
│  4 │ Upper respiratory infection      │ 25,000  │ 16.7%  │
│  5 │ Osteoarthritis                   │ 18,000  │ 12.0%  │
│  6 │ Chronic kidney disease           │ 12,000  │  8.0%  │
│  7 │ Ischemic heart disease           │ 10,000  │  6.7%  │
│  8 │ Depression                       │  8,500  │  5.7%  │
└────┴──────────────────────────────────┴─────────┴────────┘

Drill-down per condition:
  - Prevalence by month (trend over time)
  - Age at first diagnosis distribution
  - Type (inpatient / outpatient / ER)
  - Frequency distribution per person
3.4 Drug Reports
ATLAS → Data Sources → Drugs

Drug Exposure by Class (ATC):
┌──────────────────────────────────────────────────┐
│  A10 — Drugs for diabetes                        │
│  ├── Metformin:       25,000 persons             │
│  ├── Glimepiride:      8,000 persons             │
│  ├── Insulin Glargine: 5,000 persons             │
│  └── Empagliflozin:    3,000 persons             │
│                                                  │
│  C09 — ACE Inhibitors & ARBs                     │
│  ├── Enalapril:       15,000 persons             │
│  ├── Losartan:        12,000 persons             │
│  └── Valsartan:        8,000 persons             │
│                                                  │
│  C10 — Lipid Lowering Agents                     │
│  ├── Atorvastatin:    20,000 persons             │
│  ├── Rosuvastatin:    10,000 persons             │
│  └── Simvastatin:      5,000 persons             │
└──────────────────────────────────────────────────┘

Duration distribution, frequency, dosage patterns
4. ACHILLES Heel
4.1 Data Quality Warnings
# ACHILLES Heel chạy tự động cùng achilles()
# Kết quả lưu trong bảng achilles_heel_results

# Xem warnings:
conn <- connect(connectionDetails)
heel <- querySql(conn, "
  SELECT *
  FROM results.achilles_heel_results
  ORDER BY record_count DESC
  LIMIT 20
")
disconnect(conn)
4.2 Ví dụ Heel Warnings
┌─────┬──────────────────────────────────────────────┬──────────┐
│ ID  │ Warning Message                              │ Severity │
├─────┼──────────────────────────────────────────────┼──────────┤
│   1 │ 5,200 records with date before 1900          │ ERROR    │
│   2 │ 800 persons with age > 150 years             │ ERROR    │
│   3 │ Condition_occurrence has 12% unmapped codes  │ WARNING  │
│   4 │ Drug_exposure end_date < start_date (350)    │ ERROR    │
│   5 │ 15% persons with observation < 30 days       │ WARNING  │
│   6 │ Measurement has no unit_concept_id (25%)     │ WARNING  │
│   7 │ Visit_occurrence has 0 ER visits             │ NOTICE   │
│   8 │ Death records only from 2020+ (COVID bias?)  │ NOTICE   │
└─────┴──────────────────────────────────────────────┴──────────┘

Severity levels:
  ERROR:   Lỗi nghiêm trọng cần fix trước khi phân tích
  WARNING: Vấn đề nên xử lý nhưng không block
  NOTICE:  Thông tin cần kiểm tra
4.3 Xử lý Heel Warnings
-- Fix ERROR #1: Records with date before 1900
UPDATE cdm.condition_occurrence
SET condition_start_date = NULL
WHERE condition_start_date < '1900-01-01';

-- Fix ERROR #2: Age > 150
DELETE FROM cdm.person
WHERE EXTRACT(YEAR FROM CURRENT_DATE) - year_of_birth > 150;

-- Fix ERROR #4: end_date < start_date
UPDATE cdm.drug_exposure
SET drug_exposure_end_date = drug_exposure_start_date
WHERE drug_exposure_end_date < drug_exposure_start_date;

-- Sau khi fix: chạy lại ACHILLES
5. Incremental Mode
5.1 Chạy ACHILLES nhanh hơn
# Lần đầu: full run (~2-4 giờ cho 1M patients)
# Lần sau: incremental (chỉ update thay đổi)

achilles(
  connectionDetails = connectionDetails,
  cdmDatabaseSchema = "cdm",
  resultsDatabaseSchema = "results",
  sourceName = "Hospital_VN_2024",
  cdmVersion = "5.4",
  createTable = FALSE,       # không tạo lại bảng
  updateGivenAnalysesOnly = TRUE,
  analysisIds = c(1, 101, 200, 700, 1800)  # chỉ update analyses cần
)
5.2 Automation với cron
#!/bin/bash
# /opt/ohdsi/scripts/run_achilles.sh

cd /opt/ohdsi/achilles
Rscript -e '
library(Achilles)
library(DatabaseConnector)

connectionDetails <- createConnectionDetails(
  dbms = "postgresql",
  server = Sys.getenv("CDM_DB_SERVER"),
  user = Sys.getenv("CDM_DB_USER"),
  password = Sys.getenv("CDM_DB_PASS"),
  port = 5432
)

achilles(
  connectionDetails = connectionDetails,
  cdmDatabaseSchema = "cdm",
  resultsDatabaseSchema = "results",
  sourceName = "Hospital_VN_2024",
  cdmVersion = "5.4",
  numThreads = 4
)

cat("ACHILLES completed:", format(Sys.time()), "\n")
'
# Chạy ACHILLES hàng tuần (Chủ nhật 2:00 AM)
0 2 * * 0 /opt/ohdsi/scripts/run_achilles.sh >> /var/log/achilles.log 2>&1
Tóm tắt
| Thành phần | Chức năng |
|---|---|
| ACHILLES core | Tính aggregate statistics cho CDM database |
| achilles_results | Bảng chứa counts, prevalence |
| achilles_results_dist | Bảng chứa distributions (p10, p25, median...) |
| ACHILLES Heel | Phát hiện data quality issues (ERROR/WARNING/NOTICE) |
| ATLAS Data Sources | Hiển thị kết quả ACHILLES dạng dashboard |
| Incremental mode | Chạy nhanh - chỉ cập nhật thay đổi |
Bài tiếp theo: Data Quality Dashboard — Đánh giá chất lượng dữ liệu CDM