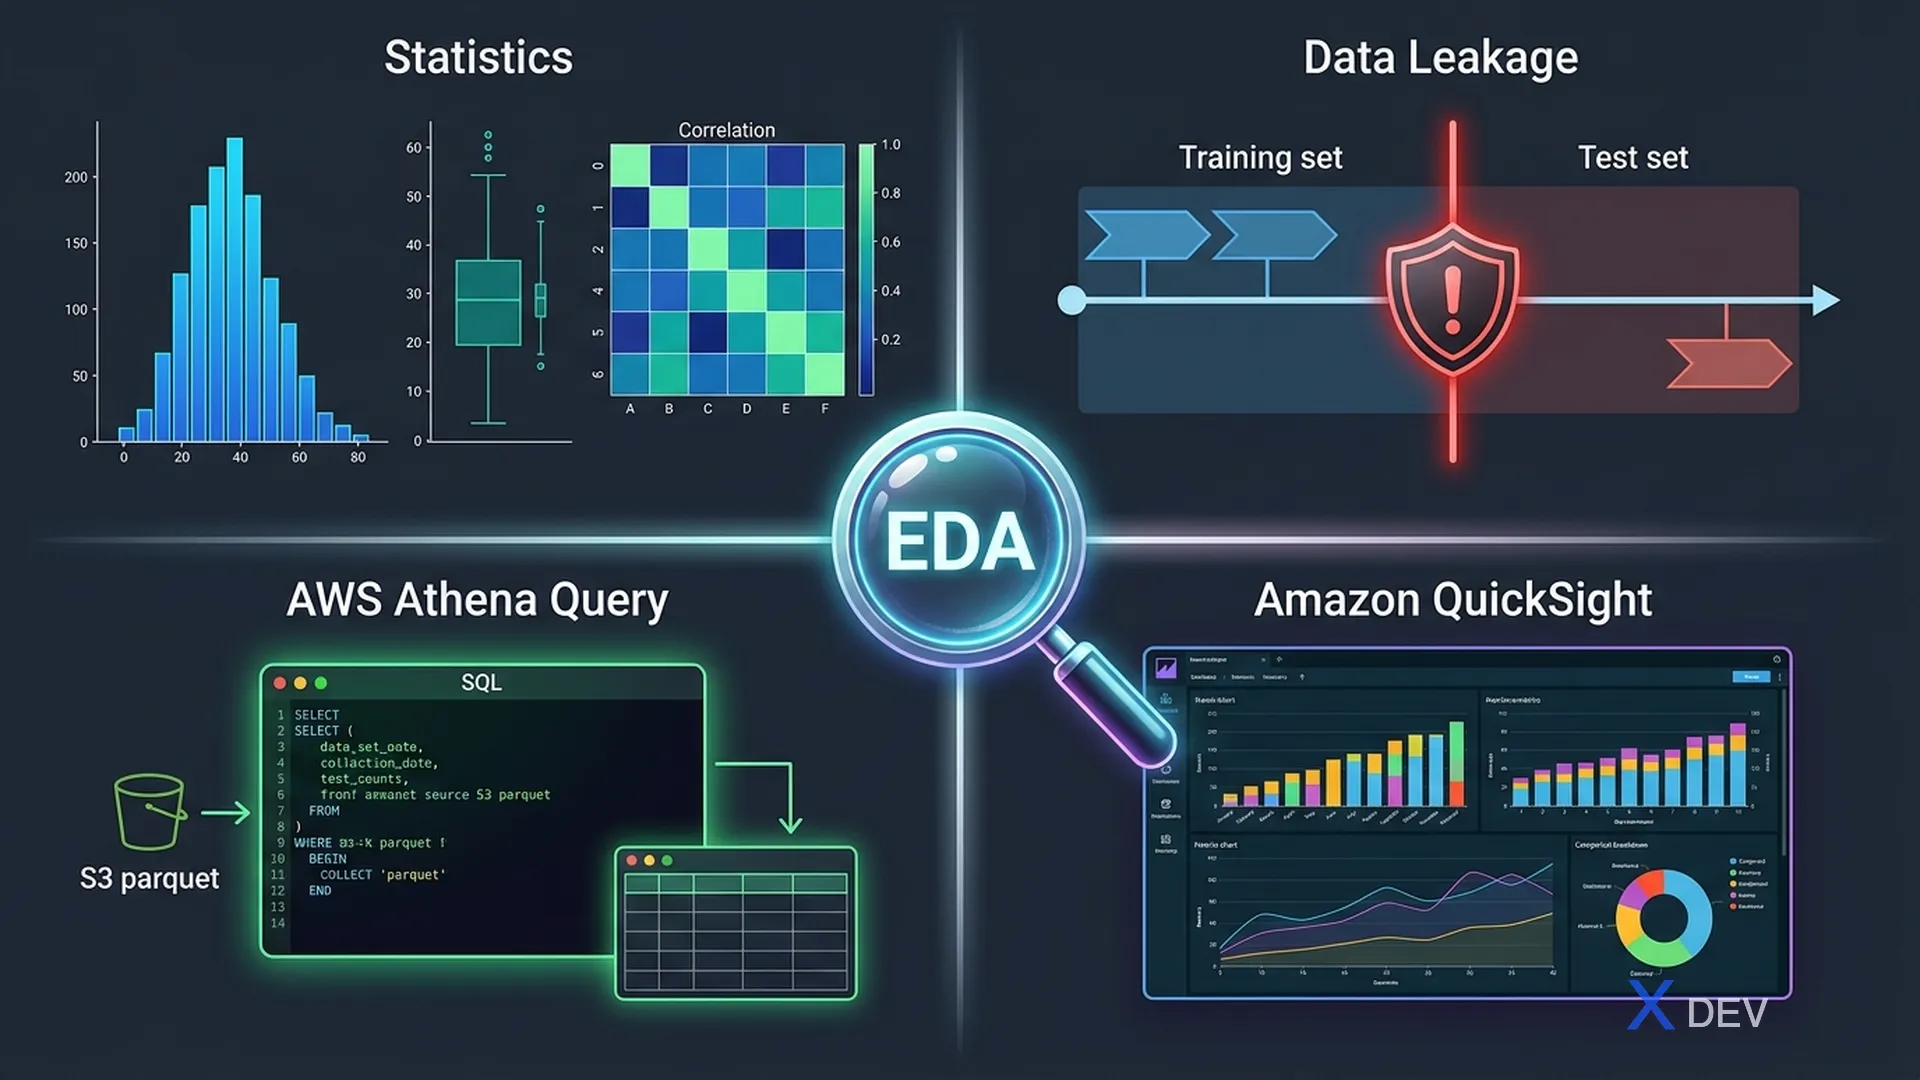
EDA & Data Analysis: descriptive statistics, detecting outliers, feature correlation on AWS
1. Exploratory Data Analysis (EDA)
EDA is the initial data analysis step to understand structure, patterns, and anomalies before modeling. SageMaker provides many tools to perform EDA at scale.
2. AWS Tools for Data Analysis
| Tool | Use Case | Interface |
|---|---|---|
| SageMaker Studio Notebooks | Interactive EDA, Python/R analysis | JupyterLab-based IDE |
| SageMaker Data Wrangler | Visual data prep, 300+ transforms, auto-insights | Drag-and-drop GUI |
| Amazon Athena | SQL queries on S3 data | SQL console |
| Amazon QuickSight | BI dashboards, executive reports | Visual BI tool |
| Amazon Redshift | Large-scale data warehousing, SQL analytics | SQL |
| AWS Glue DataBrew | No-code data profiling and cleaning recipes | Visual tool |
Exam tip: Data Wrangler = visual data prep for ML (generates SageMaker Processing code). DataBrew = data analyst/BI (no ML context). QuickSight = BI dashboards for business users, not for ML.
3. Data Quality Issues
The exam frequently asks about identifying and handling common data quality problems.
| Issue | Detection Method | Impact on Model |
|---|---|---|
| Missing Values | Null counts, missing rate per column | Errors, biased results |
| Outliers | Box plots, Z-score > 3, IQR method | Skewed weights, poor generalization |
| Class Imbalance | Class distribution histogram | Biased toward majority class |
| Feature Correlation | Correlation matrix, VIF score | Multicollinearity → unstable coefficients |
| Data Leakage | Features with suspiciously high correlation to target | Over-optimistic eval, fails in production |
| Distribution Skew | Histogram, skewness metric | Violated model assumptions |
3.1. Data Leakage — Critical Concept
Data leakage occurs when information from outside the training set leaks into features, causing the model to have high accuracy in training but fail in production.
Common Data Leakage Patterns:

❌ Target leakage:
   Feature "loan_default_flag" → predicting "credit_risk"
   (feature derived from target)

❌ Future data leakage:
   Using tomorrow's stock price to predict today's trade

❌ Train/test contamination:
   Scaling data BEFORE splitting (test mean leaks into train)

✅ Correct approach:
   Split data FIRST → fit scaler on train only → transform both
Exam tip: Always split before transforming. StandardScaler.fit() should only be called on the training set. Then transform() on both train and test. Fit+transform on the entire dataset is data leakage.
4. Amazon Athena
Athena lets you run SQL queries directly on S3 without loading data into a database. Pay per scan — optimize by using Parquet + partitioning.
Cost Optimization Tips:
┌────────────────────────────────────────────────┐
│  Partition data by date/region/category:       │
│  s3://bucket/data/year=2024/month=01/          │
│  → Query only scans the required partitions    │
│                                                │
│  Use columnar formats (Parquet/ORC):           │
│  → Read only needed columns                   │
│                                               │
│  Compress data (Snappy, Gzip):                │
│  → Reduce scan size → reduce cost             │
└────────────────────────────────────────────────┘
5. Amazon QuickSight
QuickSight is a BI service, not an ML tool. Key feature: SPICE (in-memory engine) for fast dashboards.
| Feature | Description |
|---|---|
| SPICE | Super-fast Parallel In-memory Calculation Engine — cached dataset |
| ML Insights | Built-in anomaly detection, forecasting on dashboards |
| Q (NLQ) | Natural language queries — "show me sales by region last month" |
6. Cheat Sheet — Analysis Tools
| Scenario | Tool |
|---|---|
| Interactive Python EDA on large data | SageMaker Studio Notebooks |
| Visual no-code ML data prep | SageMaker Data Wrangler |
| SQL on S3 data (serverless) | Amazon Athena |
| Business dashboards and reporting | Amazon QuickSight |
| Large data warehouse SQL | Amazon Redshift |
| No-code data profiling recipes | AWS Glue DataBrew |
7. Practice Questions
Q1: A data scientist standardized features using the mean and standard deviation of the ENTIRE dataset before splitting into train/test sets. What problem does this cause?
- A) Model underfitting
- B) Slow training convergence
- C) Data leakage from test set statistics into training ✓
- D) Class imbalance
Explanation: Fitting a scaler on the entire dataset causes data leakage — the test set statistics (mean, std) influence the training data transformation. Always fit transformers on training data only, then apply the fitted transformer to both train and test sets.
Q2: A business analyst needs to create executive dashboards from S3 data with fast interactive visualizations. Which AWS service is BEST suited?
- A) Amazon SageMaker Studio
- B) Amazon Athena
- C) Amazon QuickSight ✓
- D) AWS Glue DataBrew
Explanation: Amazon QuickSight is the AWS BI service designed for business dashboards and visualizations with SPICE in-memory engine for fast interactive queries. SageMaker Studio is for ML development, Athena is SQL querying, DataBrew is data preparation.
Q3: A model trained on customer churn data has 99% training accuracy but performs poorly on production data. Investigation shows "days_since_last_call" is more predictive than expected. What is the MOST likely cause?
- A) Overfitting due to too many features
- B) Underfitting due to low model complexity
- C) Data leakage — the feature is derived from post-churn activity ✓
- D) Class imbalance
Explanation: This is classic target leakage — "days_since_last_call" may reflect churn behavior after the fact (customers call to cancel). This future information isn't available in production, causing the model to fail.