1. Tổng quan Centralized Audit Trail cho Healthcare
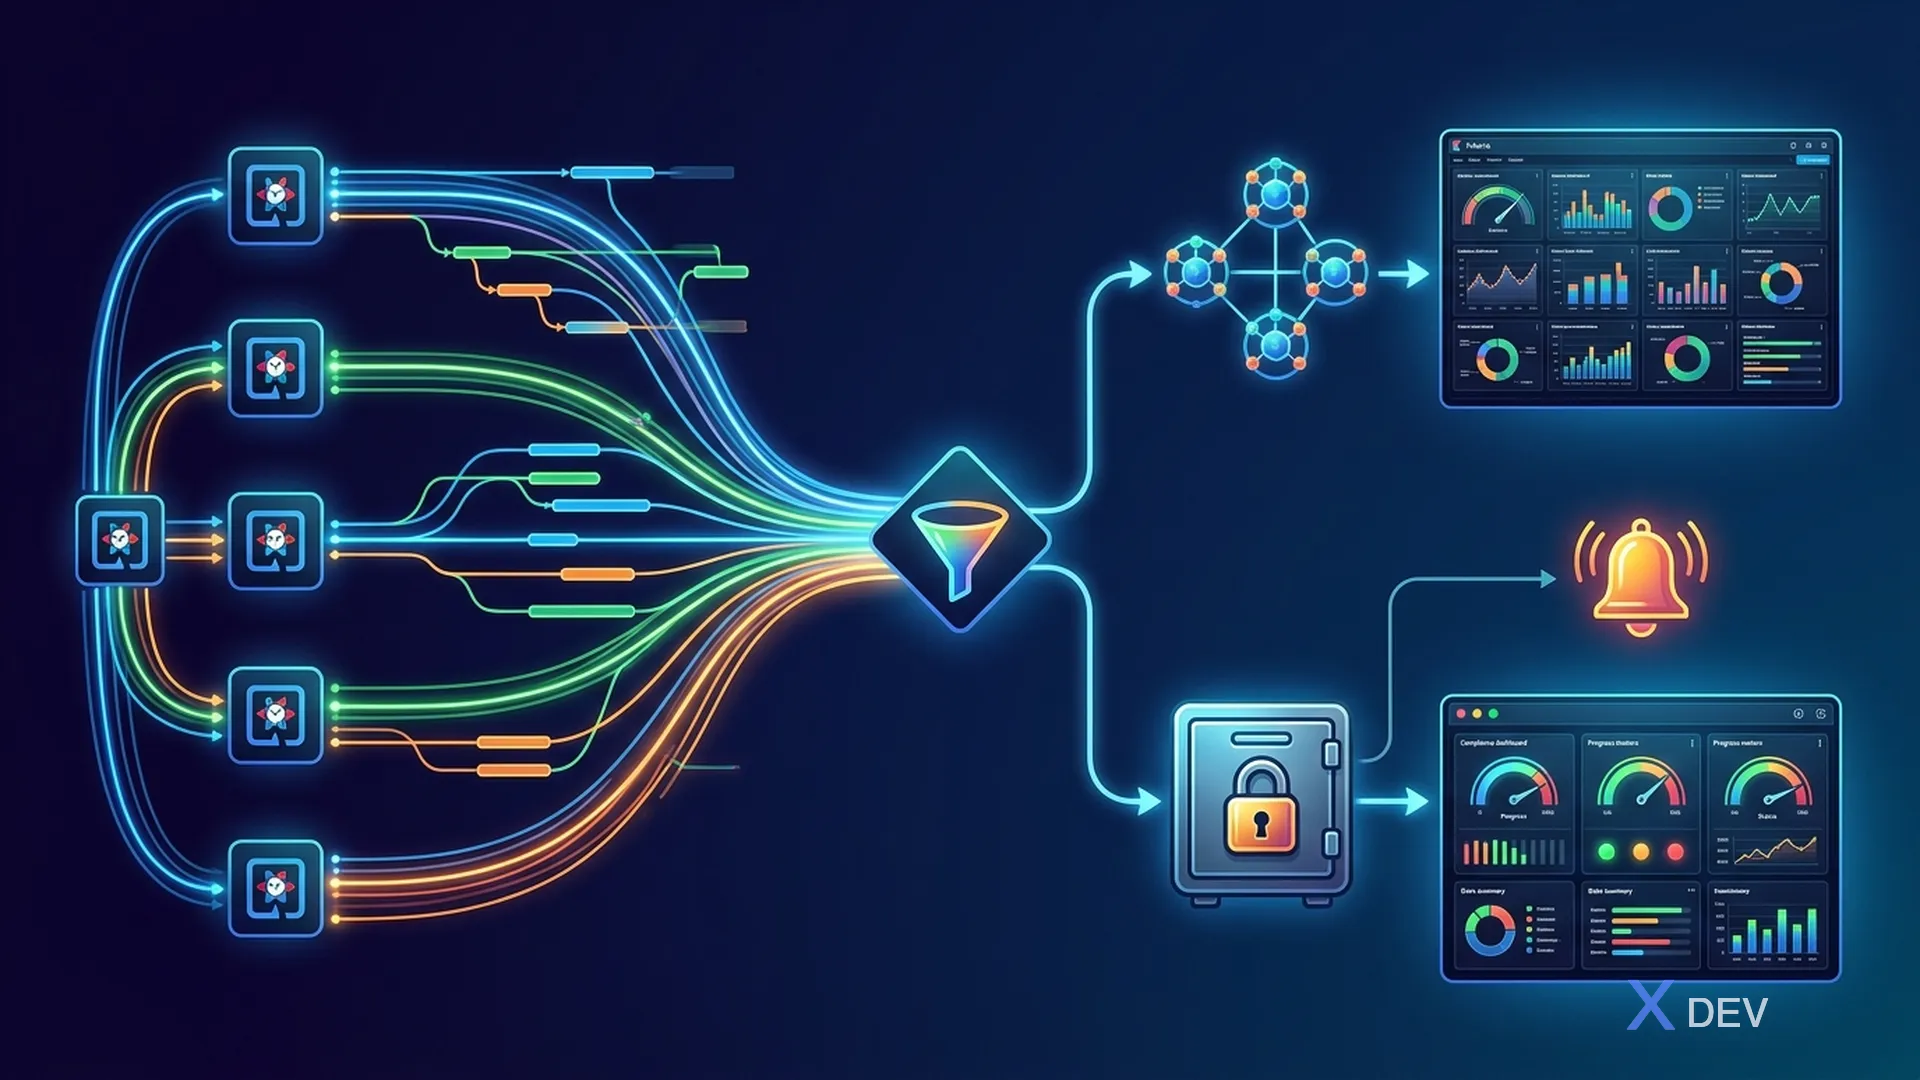
Trong hệ thống microservices y tế, một request có thể đi qua nhiều services: API Gateway → Patient Service → Lab Service → Notification Service. Để truy vết (audit) đầy đủ flow dữ liệu PHI, chúng ta cần centralized audit trail — một hệ thống tập trung ghi nhận và phân tích mọi hoạt động trên dữ liệu bệnh nhân.
1.1. Audit Trail Architecture
┌─────────────────────────────────────────────────────────────┐
│           Centralized Audit Trail Architecture               │
│                                                              │
│  ┌──────────┐  ┌──────────┐  ┌──────────┐  ┌──────────┐    │
│  │ Patient  │  │   Lab    │  │ Pharmacy │  │   API    │    │
│  │ Service  │  │ Service  │  │ Service  │  │ Gateway  │    │
│  └────┬─────┘  └────┬─────┘  └────┬─────┘  └────┬─────┘    │
│       │              │              │              │          │
│       ▼              ▼              ▼              ▼          │
│  ┌──────────────────────────────────────────────────────┐    │
│  │           OpenTelemetry Collector                     │    │
│  │   ┌──────────┐  ┌──────────┐  ┌──────────┐          │    │
│  │   │  Traces  │  │   Logs   │  │ Metrics  │          │    │
│  │   └────┬─────┘  └────┬─────┘  └────┬─────┘          │    │
│  └────────┼──────────────┼──────────────┼───────────────┘    │
│           │              │              │                     │
│           ▼              ▼              ▼                     │
│  ┌──────────┐   ┌──────────────┐   ┌──────────┐             │
│  │  Jaeger  │   │ Elasticsearch│   │Prometheus│             │
│  │ (Traces) │   │   (Logs)     │   │(Metrics) │             │
│  └──────────┘   └──────┬───────┘   └──────────┘             │
│                         │                                     │
│                    ┌────▼─────┐                               │
│                    │  Kibana  │                               │
│                    │(Dashboard│                               │
│                    │& Alerts) │                               │
│                    └──────────┘                               │
└─────────────────────────────────────────────────────────────┘
1.2. HIPAA Audit Requirements
| Yêu cầu | HIPAA Reference | Implementation |
|---|---|---|
| Ghi nhận mọi PHI access | §164.312(b) | OpenTelemetry spans + structured logs |
| Unique user identification | §164.312(a)(2)(i) | Correlation IDs trong traces |
| Review audit logs định kỳ | §164.308(a)(1)(ii)(D) | Kibana dashboards + scheduled reports |
| Phát hiện security incidents | §164.308(a)(6)(i) | Elasticsearch alerts + anomaly detection |
| Lưu trữ 6 năm | §164.530(j)(2) | Elasticsearch ILM policies |
| Bảo vệ audit logs | §164.312(c)(1) | Immutable indices, RBAC |
2. OpenTelemetry Setup cho Quarkus
2.1. Dependencies
<!-- pom.xml - OpenTelemetry cho Quarkus -->
<dependencies>
    <!-- OpenTelemetry extension (traces + metrics + logs) -->
    <dependency>
        <groupId>io.quarkus</groupId>
        <artifactId>quarkus-opentelemetry</artifactId>
    </dependency>

    <!-- OTLP exporter -->
    <dependency>
        <groupId>io.opentelemetry</groupId>
        <artifactId>opentelemetry-exporter-otlp</artifactId>
    </dependency>

    <!-- Logging JSON format -->
    <dependency>
        <groupId>io.quarkus</groupId>
        <artifactId>quarkus-logging-json</artifactId>
    </dependency>
</dependencies>
2.2. OpenTelemetry Configuration
# application.properties - OpenTelemetry

# === OpenTelemetry General ===
quarkus.otel.enabled=true
quarkus.otel.service.name=patient-service
quarkus.otel.resource.attributes=\
  service.namespace=healthcare,\
  service.version=${quarkus.application.version},\
  deployment.environment=${ENV:dev},\
  hospital.facility_id=${FACILITY_ID:HOSP-HCM-01}

# === OTLP Exporter ===
quarkus.otel.exporter.otlp.endpoint=http://otel-collector:4317
quarkus.otel.exporter.otlp.protocol=grpc
quarkus.otel.exporter.otlp.timeout=10S

# === Traces ===
quarkus.otel.traces.enabled=true
quarkus.otel.traces.sampler=parentbased_always_on
# Production: sử dụng ratio sampler
# quarkus.otel.traces.sampler=parentbased_traceidratio
# quarkus.otel.traces.sampler.arg=0.1

# === Logs ===
quarkus.otel.logs.enabled=true

# === Metrics ===
quarkus.otel.metrics.enabled=true

# === Propagation ===
quarkus.otel.propagators=tracecontext,baggage

# === JSON Logging ===
quarkus.log.console.json=true
quarkus.log.console.json.additional-field."service".value=patient-service
quarkus.log.console.json.additional-field."environment".value=${ENV:dev}
2.3. Custom Spans cho PHI Access Tracking
package vn.hospital.audit.tracing;

import io.opentelemetry.api.trace.Span;
import io.opentelemetry.api.trace.SpanKind;
import io.opentelemetry.api.trace.StatusCode;
import io.opentelemetry.api.trace.Tracer;
import io.opentelemetry.api.common.AttributeKey;
import io.opentelemetry.api.common.Attributes;
import io.opentelemetry.context.Scope;
import jakarta.enterprise.context.ApplicationScoped;
import jakarta.inject.Inject;
import org.eclipse.microprofile.jwt.JsonWebToken;
import org.jboss.logging.Logger;

/**
 * Custom OpenTelemetry spans cho healthcare audit.
 * Mỗi PHI access tạo một span chứa thông tin audit.
 */
@ApplicationScoped
public class PhiAccessTracer {

    private static final Logger LOG = Logger.getLogger(PhiAccessTracer.class);

    // Custom attribute keys cho healthcare
    private static final AttributeKey<String> ATTR_USER_ID = AttributeKey.stringKey("hipaa.user_id");
    private static final AttributeKey<String> ATTR_USERNAME = AttributeKey.stringKey("hipaa.username");
    private static final AttributeKey<String> ATTR_DEPARTMENT = AttributeKey.stringKey("hipaa.department");
    private static final AttributeKey<String> ATTR_ACTION = AttributeKey.stringKey("hipaa.action");
    private static final AttributeKey<String> ATTR_RESOURCE_TYPE = AttributeKey.stringKey("hipaa.resource_type");
    private static final AttributeKey<String> ATTR_PATIENT_ID = AttributeKey.stringKey("hipaa.patient_id");
    private static final AttributeKey<Boolean> ATTR_EMERGENCY = AttributeKey.booleanKey("hipaa.emergency_access");
    private static final AttributeKey<String> ATTR_REASON = AttributeKey.stringKey("hipaa.access_reason");
    private static final AttributeKey<Long> ATTR_RECORD_COUNT = AttributeKey.longKey("hipaa.record_count");

    @Inject
    Tracer tracer;

    @Inject
    JsonWebToken jwt;

    /**
     * Tạo traced PHI access operation.
     * Sử dụng: phiTracer.traceAccess("READ", "patient", patientId, () -> { ... });
     */
    public <T> T traceAccess(String action, String resourceType,
                              String resourceId, PhiOperation<T> operation) {
        Span span = tracer.spanBuilder("phi.access." + action.toLowerCase())
            .setSpanKind(SpanKind.INTERNAL)
            .setAttribute(ATTR_USER_ID, jwt.getSubject())
            .setAttribute(ATTR_USERNAME, jwt.getClaim("preferred_username"))
            .setAttribute(ATTR_DEPARTMENT, jwt.getClaim("department"))
            .setAttribute(ATTR_ACTION, action)
            .setAttribute(ATTR_RESOURCE_TYPE, resourceType)
            .setAttribute(ATTR_PATIENT_ID, resourceId != null ? resourceId : "N/A")
            .setAttribute(ATTR_EMERGENCY, false)
            .startSpan();

        try (Scope scope = span.makeCurrent()) {
            T result = operation.execute();

            span.setStatus(StatusCode.OK);
            span.addEvent("phi.access.success", Attributes.of(
                AttributeKey.stringKey("result"), "OK"
            ));

            // Structured log với trace context
            LOG.infof("PHI_ACCESS: action=%s resource=%s/%s user=%s department=%s",
                action, resourceType, resourceId,
                jwt.getClaim("preferred_username"),
                jwt.getClaim("department"));

            return result;
        } catch (Exception e) {
            span.setStatus(StatusCode.ERROR, e.getMessage());
            span.recordException(e);
            throw e;
        } finally {
            span.end();
        }
    }

    /**
     * Trace bulk PHI access (e.g., export, report generation).
     */
    public <T> T traceBulkAccess(String action, String resourceType,
                                  int recordCount, String reason,
                                  PhiOperation<T> operation) {
        Span span = tracer.spanBuilder("phi.bulk_access." + action.toLowerCase())
            .setSpanKind(SpanKind.INTERNAL)
            .setAttribute(ATTR_USER_ID, jwt.getSubject())
            .setAttribute(ATTR_USERNAME, jwt.getClaim("preferred_username"))
            .setAttribute(ATTR_ACTION, action)
            .setAttribute(ATTR_RESOURCE_TYPE, resourceType)
            .setAttribute(ATTR_RECORD_COUNT, (long) recordCount)
            .setAttribute(ATTR_REASON, reason)
            .startSpan();

        try (Scope scope = span.makeCurrent()) {
            T result = operation.execute();
            span.setStatus(StatusCode.OK);

            // Alert nếu bulk access lớn
            if (recordCount > 100) {
                span.addEvent("phi.bulk_access.large_volume", Attributes.of(
                    AttributeKey.longKey("record_count"), (long) recordCount,
                    AttributeKey.stringKey("alert_level"), "WARNING"
                ));
                LOG.warnf("BULK_PHI_ACCESS: user=%s records=%d action=%s reason=%s",
                    jwt.getClaim("preferred_username"), recordCount, action, reason);
            }

            return result;
        } catch (Exception e) {
            span.setStatus(StatusCode.ERROR, e.getMessage());
            span.recordException(e);
            throw e;
        } finally {
            span.end();
        }
    }

    @FunctionalInterface
    public interface PhiOperation<T> {
        T execute();
    }
}
2.4. Sử dụng PhiAccessTracer trong Service
package vn.hospital.service;

import jakarta.enterprise.context.ApplicationScoped;
import jakarta.inject.Inject;
import vn.hospital.audit.tracing.PhiAccessTracer;
import vn.hospital.entity.PatientEntity;
import vn.hospital.repository.PatientRepository;

import java.util.List;
import java.util.UUID;

@ApplicationScoped
public class PatientService {

    @Inject
    PatientRepository patientRepository;

    @Inject
    PhiAccessTracer phiTracer;

    /**
     * Get patient by ID — traced PHI access.
     */
    public PatientEntity getPatient(UUID patientId) {
        return phiTracer.traceAccess("READ", "patient", patientId.toString(), () ->
            patientRepository.findById(patientId)
        );
    }

    /**
     * Search patients — bulk access traced.
     */
    public List<PatientEntity> searchPatients(String department, int limit) {
        return phiTracer.traceBulkAccess(
            "SEARCH", "patient", limit,
            "Department patient listing",
            () -> patientRepository.findByDepartment(department, limit)
        );
    }

    /**
     * Update patient — traced PHI modification.
     */
    public PatientEntity updatePatient(UUID patientId, PatientEntity updated) {
        return phiTracer.traceAccess("UPDATE", "patient", patientId.toString(), () -> {
            PatientEntity existing = patientRepository.findById(patientId);
            existing.setFullName(updated.getFullName());
            existing.setPhoneNumber(updated.getPhoneNumber());
            existing.setEmail(updated.getEmail());
            existing.setAddress(updated.getAddress());
            return patientRepository.save(existing);
        });
    }
}
3. Distributed Tracing với Correlation IDs
3.1. Correlation ID Architecture
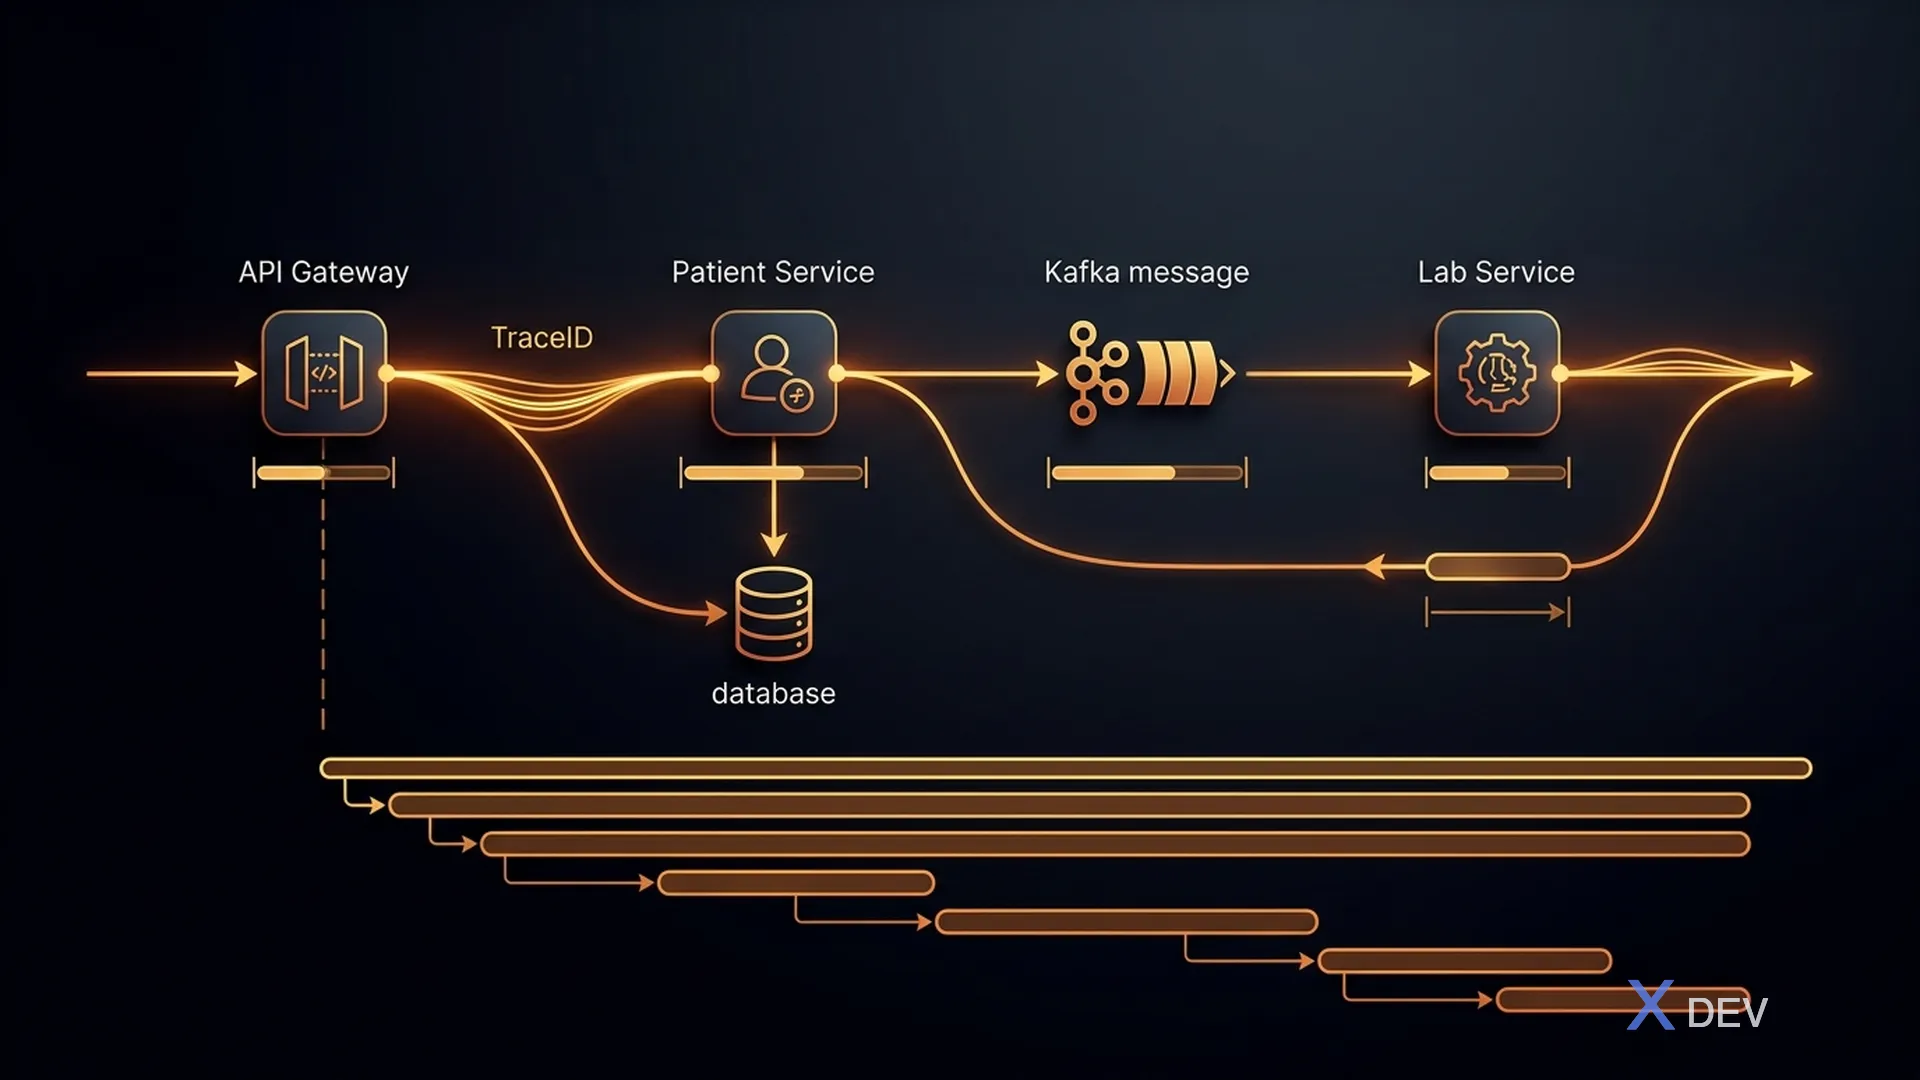
Trace Flow:
- Client Request với
X-Request-ID+traceparentheaders - API Gateway (span-1) → trace_id, user_id, client_ip
- Patient Service (span-2) → patient_id, action, department
- PostgreSQL Query (span-3) — db.statement, db.operation
- Kafka Publish (span-4) — messaging.destination, event_type
- Lab Service REST Call (span-5) — http.method, http.url
- Trace ID liên kết TẤT CẢ spans trong flow
3.2. MDC (Mapped Diagnostic Context) Integration
package vn.hospital.audit.logging;

import io.opentelemetry.api.trace.Span;
import io.opentelemetry.api.trace.SpanContext;
import jakarta.annotation.Priority;
import jakarta.inject.Inject;
import jakarta.ws.rs.container.ContainerRequestContext;
import jakarta.ws.rs.container.ContainerRequestFilter;
import jakarta.ws.rs.ext.Provider;
import org.eclipse.microprofile.jwt.JsonWebToken;
import org.jboss.logging.MDC;

import java.io.IOException;

/**
 * JAX-RS filter để set MDC fields cho structured logging.
 * Mỗi log entry tự động chứa correlation IDs.
 */
@Provider
@Priority(50)
public class CorrelationIdFilter implements ContainerRequestFilter {

    @Inject
    JsonWebToken jwt;

    @Override
    public void filter(ContainerRequestContext request) throws IOException {
        // Trace context từ OpenTelemetry
        SpanContext spanContext = Span.current().getSpanContext();
        if (spanContext.isValid()) {
            MDC.put("trace_id", spanContext.getTraceId());
            MDC.put("span_id", spanContext.getSpanId());
        }

        // Request ID (từ API Gateway hoặc generate)
        String requestId = request.getHeaderString("X-Request-ID");
        if (requestId == null) {
            requestId = java.util.UUID.randomUUID().toString();
        }
        MDC.put("request_id", requestId);

        // User context
        if (jwt.getSubject() != null) {
            MDC.put("user_id", jwt.getSubject());
            MDC.put("username", jwt.getClaim("preferred_username"));
            MDC.put("department", jwt.getClaim("department"));
        }

        // Client info
        MDC.put("client_ip", request.getHeaderString("X-Forwarded-For"));
        MDC.put("user_agent", request.getHeaderString("User-Agent"));
    }
}
3.3. Structured JSON Log Output
Với configuration ở trên, mỗi log entry sẽ có format:
{
  "timestamp": "2024-03-15T10:30:45.123Z",
  "level": "INFO",
  "loggerName": "vn.hospital.service.PatientService",
  "message": "PHI_ACCESS: action=READ resource=patient/550e8400 user=dr.nguyen department=cardiology",
  "service": "patient-service",
  "environment": "production",
  "mdc": {
    "trace_id": "abc123def456789012345678901234",
    "span_id": "1234567890abcdef",
    "request_id": "req-2024-03-15-001",
    "user_id": "keycloak-uuid-123",
    "username": "dr.nguyen",
    "department": "cardiology",
    "client_ip": "10.0.1.50"
  }
}
4. ELK Stack Deployment
4.1. Docker Compose cho Observability Stack
# docker-compose-observability.yml
version: '3.8'

services:
  # === OpenTelemetry Collector ===
  otel-collector:
    image: otel/opentelemetry-collector-contrib:0.96.0
    container_name: otel-collector
    command: ["--config=/etc/otelcol/config.yaml"]
    volumes:
      - ./config/otel-collector.yaml:/etc/otelcol/config.yaml
    ports:
      - "4317:4317"   # OTLP gRPC
      - "4318:4318"   # OTLP HTTP
      - "8888:8888"   # Metrics
    depends_on:
      - elasticsearch
      - jaeger

  # === Elasticsearch ===
  elasticsearch:
    image: docker.elastic.co/elasticsearch/elasticsearch:8.12.2
    container_name: elasticsearch
    environment:
      - discovery.type=single-node
      - xpack.security.enabled=true
      - xpack.security.http.ssl.enabled=false
      - ELASTIC_PASSWORD=${ELASTIC_PASSWORD:-changeme}
      - "ES_JAVA_OPTS=-Xms2g -Xmx2g"
      - xpack.license.self_generated.type=basic
    volumes:
      - es_data:/usr/share/elasticsearch/data
    ports:
      - "9200:9200"
    healthcheck:
      test: ["CMD-SHELL",
        "curl -s -u elastic:${ELASTIC_PASSWORD:-changeme} http://localhost:9200/_cluster/health | grep -q '\"status\":\"green\\|yellow\"'"]
      interval: 30s
      timeout: 10s
      retries: 5
    ulimits:
      memlock:
        soft: -1
        hard: -1

  # === Logstash ===
  logstash:
    image: docker.elastic.co/logstash/logstash:8.12.2
    container_name: logstash
    volumes:
      - ./config/logstash/pipeline:/usr/share/logstash/pipeline
      - ./config/logstash/logstash.yml:/usr/share/logstash/config/logstash.yml
    environment:
      - ELASTIC_PASSWORD=${ELASTIC_PASSWORD:-changeme}
      - "LS_JAVA_OPTS=-Xms1g -Xmx1g"
    ports:
      - "5044:5044"   # Beats
      - "5000:5000"   # TCP/JSON
    depends_on:
      elasticsearch:
        condition: service_healthy

  # === Kibana ===
  kibana:
    image: docker.elastic.co/kibana/kibana:8.12.2
    container_name: kibana
    environment:
      - ELASTICSEARCH_HOSTS=http://elasticsearch:9200
      - ELASTICSEARCH_USERNAME=elastic
      - ELASTICSEARCH_PASSWORD=${ELASTIC_PASSWORD:-changeme}
    ports:
      - "5601:5601"
    depends_on:
      elasticsearch:
        condition: service_healthy

  # === Jaeger (Distributed Tracing) ===
  jaeger:
    image: jaegertracing/all-in-one:1.54
    container_name: jaeger
    environment:
      - COLLECTOR_OTLP_ENABLED=true
      - SPAN_STORAGE_TYPE=elasticsearch
      - ES_SERVER_URLS=http://elasticsearch:9200
      - ES_USERNAME=elastic
      - ES_PASSWORD=${ELASTIC_PASSWORD:-changeme}
    ports:
      - "16686:16686"  # Jaeger UI
      - "14250:14250"  # gRPC
    depends_on:
      elasticsearch:
        condition: service_healthy

  # === Prometheus (Metrics) ===
  prometheus:
    image: prom/prometheus:v2.50.1
    container_name: prometheus
    volumes:
      - ./config/prometheus.yml:/etc/prometheus/prometheus.yml
      - prom_data:/prometheus
    ports:
      - "9090:9090"

  # === Grafana (Metrics Dashboards) ===
  grafana:
    image: grafana/grafana:10.3.3
    container_name: grafana
    environment:
      - GF_SECURITY_ADMIN_PASSWORD=${GRAFANA_PASSWORD:-admin}
    volumes:
      - grafana_data:/var/lib/grafana
    ports:
      - "3000:3000"
    depends_on:
      - prometheus

volumes:
  es_data:
    driver: local
  prom_data:
    driver: local
  grafana_data:
    driver: local
4.2. OpenTelemetry Collector Configuration
# config/otel-collector.yaml
receivers:
  otlp:
    protocols:
      grpc:
        endpoint: 0.0.0.0:4317
      http:
        endpoint: 0.0.0.0:4318

processors:
  batch:
    send_batch_size: 1000
    timeout: 10s

  # Thêm resource attributes
  resource:
    attributes:
      - key: deployment.environment
        value: production
        action: upsert

  # Filter sensitive data từ spans
  attributes:
    actions:
      # KHÔNG log PHI data trong traces
      - key: http.request.body
        action: delete
      - key: http.response.body
        action: delete
      - key: db.statement
        action: hash  # Hash SQL queries thay vì log plaintext

  # Memory limiter
  memory_limiter:
    check_interval: 5s
    limit_mib: 512
    spike_limit_mib: 128

exporters:
  # Traces -> Jaeger
  otlp/jaeger:
    endpoint: jaeger:4317
    tls:
      insecure: true

  # Logs -> Elasticsearch
  elasticsearch/logs:
    endpoints: ["http://elasticsearch:9200"]
    auth:
      authenticator: basicauth/es
    logs_index: healthcare-audit-logs
    sending_queue:
      enabled: true
      num_consumers: 10
      queue_size: 5000

  # Metrics -> Prometheus
  prometheus:
    endpoint: 0.0.0.0:8889

  # Debug (dev only)
  debug:
    verbosity: basic

extensions:
  basicauth/es:
    client_auth:
      username: elastic
      password: ${ELASTIC_PASSWORD}

service:
  extensions: [basicauth/es]
  pipelines:
    traces:
      receivers: [otlp]
      processors: [memory_limiter, batch, attributes]
      exporters: [otlp/jaeger]

    logs:
      receivers: [otlp]
      processors: [memory_limiter, batch]
      exporters: [elasticsearch/logs]

    metrics:
      receivers: [otlp]
      processors: [memory_limiter, batch]
      exporters: [prometheus]
5. Logstash Pipeline cho Healthcare Audit
5.1. Logstash Pipeline Configuration
# config/logstash/pipeline/healthcare-audit.conf

input {
  # Nhận logs từ Filebeat hoặc TCP
  beats {
    port => 5044
  }

  tcp {
    port => 5000
    codec => json_lines
  }
}

filter {
  # === Parse JSON log ===
  if [message] =~ /^\{/ {
    json {
      source => "message"
      target => "parsed"
    }
  }

  # === Extract audit fields ===
  if [parsed][message] =~ /^PHI_ACCESS/ {
    mutate {
      add_field => { "event_type" => "phi_access" }
    }

    # Parse PHI_ACCESS log format
    grok {
      match => {
        "[parsed][message]" => "PHI_ACCESS: action=%{WORD:audit_action} resource=%{DATA:resource_type}/%{DATA:resource_id} user=%{DATA:audit_user} department=%{GREEDYDATA:audit_department}"
      }
    }
  }

  if [parsed][message] =~ /^BULK_PHI_ACCESS/ {
    mutate {
      add_field => { "event_type" => "bulk_phi_access" }
      add_tag => ["high_priority"]
    }
  }

  if [parsed][message] =~ /^EMERGENCY ACCESS/ {
    mutate {
      add_field => { "event_type" => "emergency_access" }
      add_tag => ["critical", "emergency"]
    }
  }

  # === Extract MDC fields ===
  if [parsed][mdc] {
    mutate {
      add_field => {
        "trace_id" => "%{[parsed][mdc][trace_id]}"
        "span_id" => "%{[parsed][mdc][span_id]}"
        "request_id" => "%{[parsed][mdc][request_id]}"
        "user_id" => "%{[parsed][mdc][user_id]}"
        "username" => "%{[parsed][mdc][username]}"
        "department" => "%{[parsed][mdc][department]}"
        "client_ip" => "%{[parsed][mdc][client_ip]}"
      }
    }
  }

  # === GeoIP cho client IP ===
  if [client_ip] and [client_ip] != "" {
    geoip {
      source => "client_ip"
      target => "client_geo"
    }
  }

  # === Detect suspicious patterns ===
  # After-hours access (ngoài 6:00-22:00)
  ruby {
    code => '
      timestamp = event.get("@timestamp")
      if timestamp
        hour = timestamp.hour
        if hour < 6 || hour > 22
          event.set("suspicious_pattern", "after_hours_access")
          tags = event.get("tags") || []
          tags << "suspicious"
          event.set("tags", tags)
        end
      end
    '
  }

  # === PHI Data Masking ===
  # Đảm bảo không có PHI trong logs
  mutate {
    gsub => [
      "[parsed][message]", "\b\d{3}-?\d{2}-?\d{4}\b", "***-**-****",
      "[parsed][message]", "[a-zA-Z0-9._%+-]+@[a-zA-Z0-9.-]+\.[a-zA-Z]{2,}", "***@***.***"
    ]
  }

  # === Cleanup ===
  mutate {
    remove_field => ["[parsed][stackTrace]", "host", "agent"]
  }
}

output {
  # === Route to different indices ===
  if "emergency" in [tags] {
    elasticsearch {
      hosts => ["http://elasticsearch:9200"]
      user => "elastic"
      password => "${ELASTIC_PASSWORD}"
      index => "healthcare-emergency-%{+YYYY.MM}"
      action => "create"  # Append-only (no updates)
    }
  } else if [event_type] == "phi_access" or [event_type] == "bulk_phi_access" {
    elasticsearch {
      hosts => ["http://elasticsearch:9200"]
      user => "elastic"
      password => "${ELASTIC_PASSWORD}"
      index => "healthcare-audit-%{+YYYY.MM}"
      action => "create"
    }
  } else {
    elasticsearch {
      hosts => ["http://elasticsearch:9200"]
      user => "elastic"
      password => "${ELASTIC_PASSWORD}"
      index => "healthcare-app-%{+YYYY.MM}"
    }
  }

  # Debug output (dev only)
  # stdout { codec => rubydebug }
}
6. Elasticsearch Index Templates & ILM
6.1. Index Template cho Audit Logs
{
  "index_patterns": ["healthcare-audit-*"],
  "template": {
    "settings": {
      "number_of_shards": 2,
      "number_of_replicas": 1,
      "index.lifecycle.name": "hipaa-retention-policy",
      "index.lifecycle.rollover_alias": "healthcare-audit",
      "index.mapping.total_fields.limit": 2000,
      "index.blocks.read_only_allow_delete": false
    },
    "mappings": {
      "properties": {
        "@timestamp": { "type": "date" },
        "event_type": { "type": "keyword" },
        "trace_id": { "type": "keyword" },
        "span_id": { "type": "keyword" },
        "request_id": { "type": "keyword" },

        "user_id": { "type": "keyword" },
        "username": { "type": "keyword" },
        "department": { "type": "keyword" },

        "audit_action": { "type": "keyword" },
        "resource_type": { "type": "keyword" },
        "resource_id": { "type": "keyword" },

        "client_ip": { "type": "ip" },
        "user_agent": { "type": "text" },
        "service_name": { "type": "keyword" },

        "suspicious_pattern": { "type": "keyword" },

        "client_geo": {
          "properties": {
            "city_name": { "type": "keyword" },
            "country_name": { "type": "keyword" },
            "location": { "type": "geo_point" }
          }
        },

        "parsed": {
          "properties": {
            "level": { "type": "keyword" },
            "loggerName": { "type": "keyword" },
            "message": { "type": "text" }
          }
        }
      }
    }
  },
  "priority": 200,
  "composed_of": [],
  "version": 1,
  "_meta": {
    "description": "HIPAA compliant audit log index template",
    "retention": "6 years per §164.530(j)(2)"
  }
}
6.2. ILM Policy — HIPAA 6-Year Retention
{
  "policy": {
    "phases": {
      "hot": {
        "min_age": "0ms",
        "actions": {
          "rollover": {
            "max_primary_shard_size": "25gb",
            "max_age": "30d"
          },
          "set_priority": {
            "priority": 100
          }
        }
      },
      "warm": {
        "min_age": "90d",
        "actions": {
          "shrink": {
            "number_of_shards": 1
          },
          "forcemerge": {
            "max_num_segments": 1
          },
          "readonly": {},
          "set_priority": {
            "priority": 50
          }
        }
      },
      "cold": {
        "min_age": "365d",
        "actions": {
          "searchable_snapshot": {
            "snapshot_repository": "healthcare-audit-snapshots"
          },
          "set_priority": {
            "priority": 0
          }
        }
      },
      "delete": {
        "min_age": "2190d",
        "actions": {
          "wait_for_snapshot": {
            "policy": "healthcare-daily-snapshots"
          },
          "delete": {}
        }
      }
    },
    "_meta": {
      "description": "HIPAA requires 6 years (2190 days) retention for audit logs",
      "hipaa_reference": "§164.530(j)(2)"
    }
  }
}
6.3. Setup Script
#!/bin/bash
# setup-elasticsearch.sh
# Khởi tạo Elasticsearch indices, templates, và ILM policies

set -euo pipefail

ES_URL="${ES_URL:-http://localhost:9200}"
ES_USER="${ES_USER:-elastic}"
ES_PASS="${ES_PASS:-changeme}"
AUTH="-u ${ES_USER}:${ES_PASS}"

echo "=== Setting up Elasticsearch for Healthcare Audit ==="

# 1. Create ILM Policy
echo "Creating ILM policy..."
curl -s -X PUT "${ES_URL}/_ilm/policy/hipaa-retention-policy" \
  $AUTH -H 'Content-Type: application/json' \
  -d @config/elasticsearch/ilm-policy.json

# 2. Create Index Template
echo "Creating index template..."
curl -s -X PUT "${ES_URL}/_index_template/healthcare-audit-template" \
  $AUTH -H 'Content-Type: application/json' \
  -d @config/elasticsearch/audit-index-template.json

# 3. Create initial index with alias
echo "Creating initial audit index..."
curl -s -X PUT "${ES_URL}/healthcare-audit-000001" \
  $AUTH -H 'Content-Type: application/json' \
  -d '{
    "aliases": {
      "healthcare-audit": {
        "is_write_index": true
      }
    }
  }'

# 4. Create snapshot repository (cho cold phase)
echo "Creating snapshot repository..."
curl -s -X PUT "${ES_URL}/_snapshot/healthcare-audit-snapshots" \
  $AUTH -H 'Content-Type: application/json' \
  -d '{
    "type": "fs",
    "settings": {
      "location": "/mnt/snapshots/healthcare-audit",
      "compress": true
    }
  }'

# 5. Create RBAC roles
echo "Creating audit reader role..."
curl -s -X PUT "${ES_URL}/_security/role/audit_reader" \
  $AUTH -H 'Content-Type: application/json' \
  -d '{
    "indices": [
      {
        "names": ["healthcare-audit-*"],
        "privileges": ["read", "view_index_metadata"]
      }
    ]
  }'

echo "Creating audit writer role..."
curl -s -X PUT "${ES_URL}/_security/role/audit_writer" \
  $AUTH -H 'Content-Type: application/json' \
  -d '{
    "indices": [
      {
        "names": ["healthcare-audit-*"],
        "privileges": ["create_doc", "create_index", "view_index_metadata"]
      }
    ]
  }'

echo "=== Setup complete ==="
7. Kibana Dashboards cho Audit Visualization
7.1. Audit Dashboard Saved Objects
{
  "objects": [
    {
      "id": "healthcare-audit-dashboard",
      "type": "dashboard",
      "attributes": {
        "title": "Healthcare PHI Access Audit",
        "description": "HIPAA Compliance - PHI Access Monitoring Dashboard",
        "panelsJSON": "[{\"gridData\":{\"x\":0,\"y\":0,\"w\":24,\"h\":8},\"type\":\"lens\",\"title\":\"PHI Access Over Time\"},{\"gridData\":{\"x\":24,\"y\":0,\"w\":24,\"h\":8},\"type\":\"lens\",\"title\":\"Access by Department\"},{\"gridData\":{\"x\":0,\"y\":8,\"w\":16,\"h\":8},\"type\":\"lens\",\"title\":\"Top Users by PHI Access\"},{\"gridData\":{\"x\":16,\"y\":8,\"w\":16,\"h\":8},\"type\":\"lens\",\"title\":\"Suspicious Access Patterns\"},{\"gridData\":{\"x\":32,\"y\":8,\"w\":16,\"h\":8},\"type\":\"lens\",\"title\":\"Emergency Access Events\"},{\"gridData\":{\"x\":0,\"y\":16,\"w\":48,\"h\":12},\"type\":\"lens\",\"title\":\"Audit Log Details\"}]"
      }
    }
  ]
}
7.2. Key Visualizations
Visualization 1: PHI Access Over Time
{
  "title": "PHI Access Volume Over Time",
  "visType": "line",
  "params": {
    "index_pattern": "healthcare-audit-*",
    "time_field": "@timestamp",
    "metrics": [
      {
        "type": "count",
        "label": "Total PHI Access"
      }
    ],
    "buckets": [
      {
        "type": "date_histogram",
        "field": "@timestamp",
        "interval": "1h"
      }
    ],
    "split_series": {
      "field": "audit_action",
      "terms": ["READ", "UPDATE", "CREATE", "DELETE"]
    }
  }
}
Visualization 2: Suspicious Access Detection
Elasticsearch query cho suspicious patterns:
{
  "query": {
    "bool": {
      "should": [
        {
          "term": { "suspicious_pattern": "after_hours_access" }
        },
        {
          "range": {
            "hipaa.record_count": { "gte": 100 }
          }
        },
        {
          "term": { "event_type": "emergency_access" }
        }
      ],
      "minimum_should_match": 1,
      "filter": [
        {
          "range": {
            "@timestamp": { "gte": "now-24h" }
          }
        }
      ]
    }
  },
  "aggs": {
    "by_pattern": {
      "terms": { "field": "suspicious_pattern" }
    },
    "by_user": {
      "terms": {
        "field": "username",
        "size": 10
      }
    }
  }
}
8. Alert Rules cho Healthcare
8.1. Elasticsearch Watcher Alerts
{
  "trigger": {
    "schedule": { "interval": "5m" }
  },
  "input": {
    "search": {
      "request": {
        "indices": ["healthcare-audit-*"],
        "body": {
          "query": {
            "bool": {
              "must": [
                { "term": { "event_type": "bulk_phi_access" } },
                { "range": { "@timestamp": { "gte": "now-5m" } } }
              ],
              "filter": [
                { "range": { "hipaa.record_count": { "gte": 50 } } }
              ]
            }
          },
          "aggs": {
            "by_user": {
              "terms": { "field": "username", "size": 5 },
              "aggs": {
                "total_records": {
                  "sum": { "field": "hipaa.record_count" }
                }
              }
            }
          }
        }
      }
    }
  },
  "condition": {
    "compare": {
      "ctx.payload.hits.total.value": { "gte": 1 }
    }
  },
  "actions": {
    "notify_security": {
      "webhook": {
        "method": "POST",
        "url": "https://hooks.slack.com/services/xxx/yyy/zzz",
        "headers": { "Content-Type": "application/json" },
        "body": "{\"text\": \"HIPAA ALERT: Bulk PHI access detected. {{ctx.payload.hits.total.value}} events in last 5 minutes. Check Kibana dashboard.\"}"
      }
    },
    "log_alert": {
      "logging": {
        "text": "HIPAA ALERT: Bulk PHI access - {{ctx.payload.hits.total.value}} events"
      }
    }
  }
}
8.2. Alert Scenarios
| Alert | Trigger | Severity | Action |
|---|---|---|---|
| Bulk PHI Access | >50 records in 5 min | HIGH | Slack + Email Security Team |
| After-Hours Access | PHI access 22:00-06:00 | MEDIUM | Log + Daily report |
| Unauthorized Department | Access outside own department | HIGH | Slack + Audit review |
| Emergency Access | Break-the-Glass activated | CRITICAL | Immediate notification |
| Failed Auth Spike | >10 failures in 5 min | HIGH | Slack + Account lockout check |
| Export/Download PHI | Data export triggered | MEDIUM | Log + Weekly review |
| New IP Address | PHI access from unknown IP | LOW | Log + Monthly review |
8.3. After-Hours Access Alert
{
  "trigger": {
    "schedule": { "interval": "10m" }
  },
  "input": {
    "search": {
      "request": {
        "indices": ["healthcare-audit-*"],
        "body": {
          "query": {
            "bool": {
              "must": [
                { "exists": { "field": "audit_action" } },
                { "range": { "@timestamp": { "gte": "now-10m" } } },
                { "term": { "suspicious_pattern": "after_hours_access" } }
              ]
            }
          }
        }
      }
    }
  },
  "condition": {
    "compare": {
      "ctx.payload.hits.total.value": { "gte": 1 }
    }
  },
  "actions": {
    "log_after_hours": {
      "logging": {
        "text": "AFTER-HOURS PHI ACCESS: {{ctx.payload.hits.total.value}} events detected"
      }
    }
  }
}
9. SIEM Integration
9.1. SIEM Architecture
┌─────────────────────────────────────────────────────────────┐
│              SIEM Integration Architecture                    │
│                                                              │
│  Healthcare Microservices                                     │
│    │                                                         │
│    ├── Application Logs ──► Logstash ──► Elasticsearch       │
│    ├── Audit Events ─────► Logstash ──► Elasticsearch        │
│    ├── Network Logs ─────► Logstash ──► Elasticsearch        │
│    └── Security Events ──► Logstash ──► Elasticsearch        │
│                                              │               │
│                                              ▼               │
│                                    ┌──────────────────┐      │
│                                    │   SIEM Platform   │      │
│                                    │  (Elastic SIEM /  │      │
│                                    │   Splunk / QRadar)│      │
│                                    └────────┬─────────┘      │
│                                             │                │
│                              ┌──────────────┼──────────┐     │
│                              ▼              ▼          ▼     │
│                         Correlation    Anomaly     Incident  │
│                         Rules         Detection   Response   │
│                                                              │
│  Example Correlation Rules:                                  │
│    IF user.department != resource.department                 │
│       AND action = "READ"                                    │
│       AND resource_type = "patient"                          │
│    THEN alert("Cross-Department PHI Access")                 │
│                                                              │
│    IF count(action="LOGIN_FAILED") > 5 within 5min          │
│       AND THEN action = "LOGIN" success                      │
│    THEN alert("Possible Brute Force + Compromise")           │
└─────────────────────────────────────────────────────────────┘
9.2. Elasticsearch Detection Rules
{
  "name": "Cross-Department PHI Access",
  "description": "Detects when a user accesses patient data outside their department",
  "rule_id": "hipaa-cross-dept-001",
  "severity": "high",
  "type": "query",
  "index": ["healthcare-audit-*"],
  "query": "event_type:phi_access AND NOT (department:audit_department)",
  "interval": "5m",
  "actions": [
    {
      "action_type_id": ".slack",
      "params": {
        "message": "Cross-department PHI access detected: {{context.rule.name}}"
      }
    }
  ]
}
10. Log Retention & Compliance
10.1. HIPAA Log Retention Requirements
┌─────────────────────────────────────────────────────────────┐
│         Log Retention Timeline (HIPAA §164.530(j)(2))        │
│                                                              │
│  Year 0-1 (HOT):                                            │
│    └── Full searchable indices on SSD                        │
│    └── Real-time queries, dashboards, alerts                 │
│    └── Primary + 1 replica                                   │
│                                                              │
│  Year 1-3 (WARM):                                            │
│    └── Force-merged, read-only indices on HDD                │
│    └── Slower queries but still searchable                   │
│    └── Shrunk to 1 shard                                     │
│                                                              │
│  Year 3-6 (COLD):                                            │
│    └── Searchable snapshots (S3/GCS/Azure Blob)              │
│    └── Restored on-demand for investigations                 │
│    └── Minimal storage cost                                  │
│                                                              │
│  Year 6+ (DELETE):                                           │
│    └── Verified snapshot exists                               │
│    └── Safe deletion after final audit check                 │
│    └── Deletion itself is audited                            │
└─────────────────────────────────────────────────────────────┘
10.2. Retention Verification Script
#!/bin/bash
# verify-log-retention.sh
# Verify HIPAA log retention compliance

ES_URL="${ES_URL:-http://localhost:9200}"
AUTH="-u elastic:${ELASTIC_PASSWORD}"

echo "=== HIPAA Log Retention Verification ==="
echo "Date: $(date -u +"%Y-%m-%dT%H:%M:%SZ")"

# Check oldest audit log
OLDEST=$(curl -s $AUTH "${ES_URL}/healthcare-audit-*/_search" \
  -H 'Content-Type: application/json' \
  -d '{"size":1,"sort":[{"@timestamp":"asc"}],"_source":["@timestamp"]}' \
  | jq -r '.hits.hits[0]._source["@timestamp"]' 2>/dev/null)

echo "Oldest audit log: $OLDEST"

# Check ILM policy
ILM_STATUS=$(curl -s $AUTH "${ES_URL}/_ilm/policy/hipaa-retention-policy" \
  | jq -r '.hipaa-retention-policy.policy.phases.delete.min_age' 2>/dev/null)

echo "Delete phase min_age: $ILM_STATUS"

# Check total audit entries
TOTAL=$(curl -s $AUTH "${ES_URL}/healthcare-audit-*/_count" \
  | jq -r '.count' 2>/dev/null)

echo "Total audit entries: $TOTAL"

# Check snapshot repository
SNAPSHOTS=$(curl -s $AUTH "${ES_URL}/_snapshot/healthcare-audit-snapshots/_all" \
  | jq '.snapshots | length' 2>/dev/null)

echo "Total snapshots: $SNAPSHOTS"

# Verify no premature deletions
SIX_YEARS_AGO=$(date -u -v-2190d +"%Y-%m-%dT%H:%M:%SZ" 2>/dev/null \
  || date -u -d "2190 days ago" +"%Y-%m-%dT%H:%M:%SZ")

ENTRIES_BEFORE=$(curl -s $AUTH "${ES_URL}/healthcare-audit-*/_count" \
  -H 'Content-Type: application/json' \
  -d "{\"query\":{\"range\":{\"@timestamp\":{\"lt\":\"$SIX_YEARS_AGO\"}}}}" \
  | jq -r '.count' 2>/dev/null)

if [ "$ENTRIES_BEFORE" = "0" ]; then
    echo "[PASS] No audit entries older than 6 years (correctly deleted)"
else
    echo "[INFO] $ENTRIES_BEFORE entries older than 6 years (review retention)"
fi

echo "=== Verification complete ==="
Tổng kết
Trong bài học này, chúng ta đã xây dựng Centralized Audit Trail hoàn chỉnh cho healthcare microservices:
- OpenTelemetry Instrumentation: Custom spans cho PHI access (PhiAccessTracer), distributed tracing tự động, OTLP export
- Correlation IDs: MDC integration — trace_id, span_id, request_id, user_id trong mọi log entry
- Structured Logging: JSON format, PHI masking filter, consistent log schema
- ELK Stack Deployment: Docker Compose stack với Elasticsearch, Logstash, Kibana, Jaeger, Prometheus
- Logstash Pipeline: Healthcare-specific parsing, suspicious pattern detection, audit event routing
- Index Templates & ILM: Elasticsearch templates cho audit data, 6-year retention policy (Hot → Warm → Cold → Delete)
- Kibana Dashboards: PHI access visualization, department breakdown, suspicious activity tracking
- Alert Rules: Bulk PHI access, after-hours access, unauthorized department access, emergency access notifications
- SIEM Integration: Correlation rules, cross-department detection, anomaly detection architecture
- Retention Compliance: Automated verification scripts, snapshot management, deletion auditing
Bài tập
-
OpenTelemetry Setup: Thêm
quarkus-opentelemetryvào Quarkus project. Cấu hình OTLP exporter tới local Jaeger (docker run jaegertracing/all-in-one). Implement PhiAccessTracer và wrap Patient CRUD operations. Verify traces hiển thị trong Jaeger UI với custom attributes (user_id, patient_id, action). -
ELK Stack Deployment: Chạy Docker Compose observability stack. Tạo Elasticsearch index template cho
healthcare-audit-*. Cấu hình ILM policy với 4 phases (hot/warm/cold/delete). Verify ILM policy bằngGET _ilm/policy/hipaa-retention-policy. Gửi sample audit events qua Logstash TCP input. -
Kibana Dashboard: Import audit index pattern vào Kibana. Tạo 3 visualizations: (a) PHI access timeline, (b) Top users by access count, (c) Access by department pie chart. Combine thành 1 dashboard. Tạo saved search cho suspicious patterns.
-
Alert Configuration: Tạo Elasticsearch Watcher cho bulk PHI access alert (>50 records in 5 min). Tạo after-hours access alert (22:00-06:00). Test bằng cách gửi sample events qua API. Verify alert fires và notification được gửi (sử dụng webhook.site cho testing).
| ◀ Bài trước | Bài tiếp theo ▶ |
|---|---|
| Bài 17: HIPAA Technical Safeguards - Checklist Triển khai Đầy đủ | Bài 19: Data Masking, Anonymization & De-identification cho PHI |