Observability Stack 2026 — PLG + OpenTelemetry
In the modern world of distributed systems, understanding the internal state of a system based on what it outputs to the outside is the core definition of Observability. Unlike traditional monitoring — which only asks the question "is the system working?" — observability allows you to ask "why does the system behave the way it does?" even in situations you never expected.
This lesson will provide a comprehensive introduction to the recommended Observability Stack for 2026, including the three observability pillars, the OpenTelemetry standard, the contrast between the PLG and EFK stacks, and Grafana Alloy's role as a unified collector.
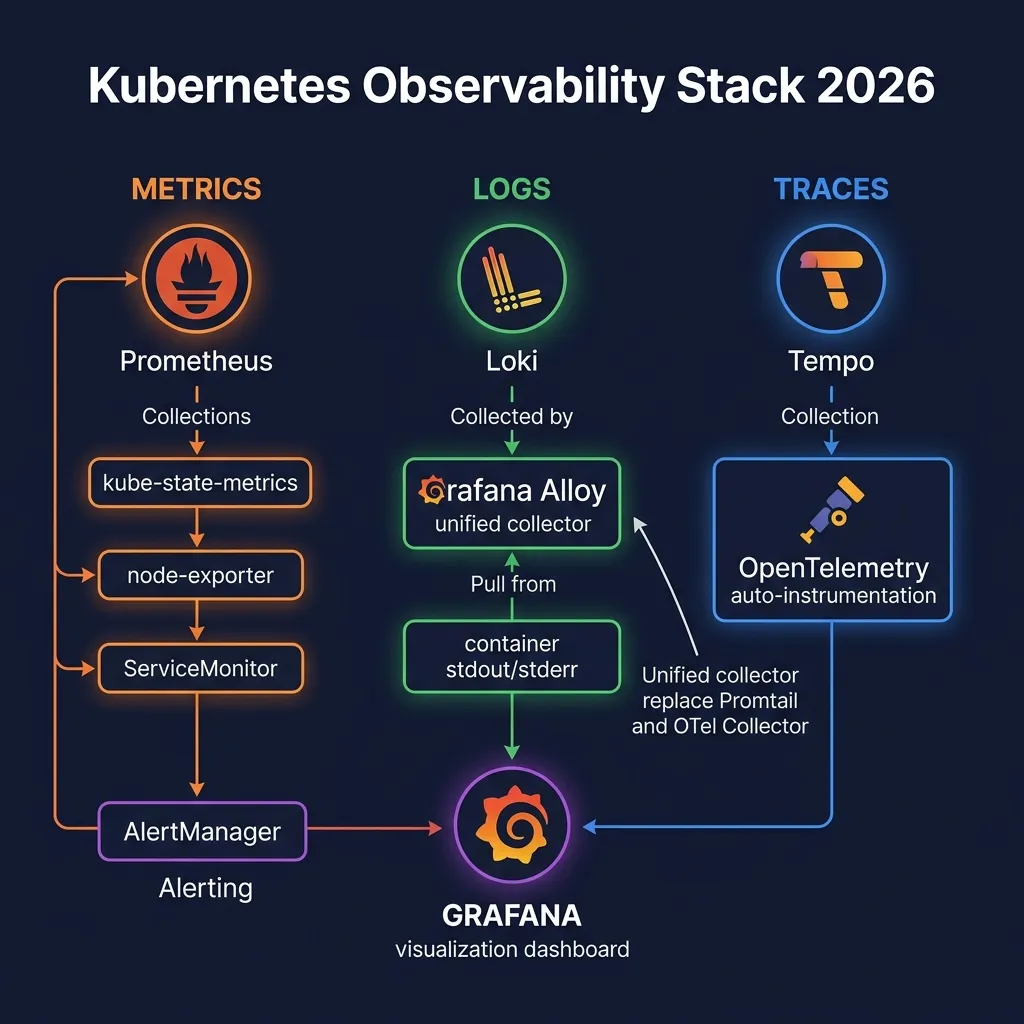
The Three Pillars of Observability__HTMLTAG_10___
Every observability system revolves around three basic types of signals. Understanding each type and how they complement each other is the foundation for building an effective observation system.
Metrics — Numerical Data Over Time
Metrics are numerical values that are measured and collected over time. They allow you to observe trends, set alert thresholds, and detect anomalies. For example: number of requests per second, CPU usage, average latency, error rate.
The advantages of metrics are low storage costs, fast queries, and are very suitable for alerting. However, metrics cannot tell you why a value is unusual — you need logs and traces to investigate further.
Logs — Event Log
Logs are event logs generated by applications and systems. They provide the most detailed context about what happened at a particular time. Each log entry usually includes timestamp, severity level, message, and metadata fields.
Logs are very powerful when you have identified the time period and problematic component (from metrics alert), and need to understand more detail. The challenge with logs is the huge volume of data and the storage/query costs can be very high.
Traces — Request Trace
Distributed traces track a request across multiple services and components. Each trace consists of multiple spans — units of work with start and end timestamps, operation names, and metadata. Traces help you understand dependencies between services, identify bottlenecks, and debug latency-related errors.
Why Need All Three?
Three pillars that work together in a typical investigation process:
- Metrics alert warns that error rate is increasing at 2:30 AM
- You open Grafana dashboardto view metrics and realize that service payment is having problems
- You jump to Loki logs for service payment during that time and see "connection refused" errors
- You click on a trace ID in the log line and jump to Tempo traces to see that the request is being timed out at the database call
- Conclusion: database connection pool is exhausted
None of the three pillars can provide enough information alone. The power lies in the combination and correlation between them.
OpenTelemetry — Unique Standard 2026
Before OpenTelemetry, each vendor (Datadog, New Relic, Jaeger, Zipkin...) had its own SDK and agent. Changing vendor means rewriting the instrumentation code. OpenTelemetry (OTel) was born to solve this vendor lock-in problem.
What is OpenTelemetry?
OpenTelemetry is a CNCF Graduated Project — the industry standard for collecting and exporting telemetry data (metrics, logs, traces). Formed from the merger of OpenCensus and OpenTracing in 2019, by 2026 OTel has become the undisputed standard in the cloud-native ecosystem.
Vendor-Agnostic Architecture
OTel architecture clearly separates instrumentation (how to collect data) and export (where to send data). You instrument once, then you can send data to Prometheus, Jaeger, Datadog, New Relic or any backend simply by changing the exporter configuration.
Auto-Instrumentation — No Need to Change Code
One of OTel's most powerful features is its auto-instrumentation capabilities. With popular languages such as Java, Python, Node.js, and .NET, OTel can automatically inject instrumentation without the need for developers to change any lines of code. This is especially useful for:
- Legacy applications without instrumentation__HTMLTAG_77___
- Third-party libraries whose source code you do not control
- Rapid rollout instrumentation for the entire fleet__HTMLTAG_81___
OTLP Protocol — Unified Transport
OpenTelemetry Line Protocol (OTLP) is a unified protocol for transporting metrics, logs, and traces. OTLP supports both gRPC (port 4317) and HTTP (port 4318). Having a single protocol for all three signal types greatly simplifies network configuration, firewall rules, and load balancing.
OpenTelemetry Operator for Kubernetes
OpenTelemetry Operator is a Kubernetes Operator that manages deployment and configuration of OTel Collectors and auto-instrumentation. It provides two main CRDs:
- OpenTelemetryCollector: deploy and configure OTel Collector instances
- Instrumentation: configure auto-instrumentation for workloads
apiVersion: opentelemetry.io/v1alpha1
kind: Instrumentation
metadata:
  name: my-instrumentation
spec:
  exporter:
    endpoint: http://otel-collector:4317
  propagators:
    - tracecontext
    - baggage
  sampler:
    type: parentbased_traceidratio
    argument: "0.1"
  java:
    image: ghcr.io/open-telemetry/opentelemetry-operator/autoinstrumentation-java:latest
  nodejs:
    image: ghcr.io/open-telemetry/opentelemetry-operator/autoinstrumentation-nodejs:latest
  python:
    image: ghcr.io/open-telemetry/opentelemetry-operator/autoinstrumentation-python:latest
After applying Instrumentation CRD, you just need to add annotation to the Pod to activate auto-instrumentation:
annotations:
  instrumentation.opentelemetry.io/inject-java: "true"
PLG Stack vs EFK Stack
The two most popular stacks for log aggregation and observability in Kubernetes are PLG (Prometheus + Loki + Grafana) and EFK (Elasticsearch + Fluentd/Fluent Bit + Kibana). Choosing between them depends on the specific use case.
PLG Stack — Lightweight, Cheap, Label-Based
PLG stack is designed for cloud-native environments with the philosophy of "index labels, not content":
- Prometheus: collect and store metrics in time series
- Loki: log aggregation with label-based indexing (like Prometheus but for logs)
- Grafana: unified visualization for all data sources
Loki does not index log content (only labels), which makes storage and operating costs significantly lower than Elasticsearch. Tradeoff is a less powerful full-text search. But for most use cases — queries by service, namespace, time range, pattern matching — Loki is perfectly adequate.
EFK Stack — Full-Text Search, Heavier
EFK stack optimized for full-text search and complex analytics:
- Elasticsearch: full-text indexed log storage, very strong in search
- Fluentd/Fluent Bit: log collector and processor
- Kibana: visualization and search UI for Elasticsearch
Elasticsearch indexes the entire log content, allowing for extremely powerful full-text search. However, this comes at a cost: Elasticsearch consumes significantly more RAM and CPU, requires a cluster minimum of 3 nodes to ensure HA, and has much higher operating costs.
When to Use EFK?
Select EFK when:
- Need full-text search in log content (for example, search by error message optionally)
- Need complex aggregations and analytics on log data
- Team has experience with Elasticsearch
- Budget is not a problem and requires Elastic's enterprise features
For most teams, the PLG stack is the better choice for Kubernetes observability in 2026. Lower operating costs, better integration with the Prometheus ecosystem, and better scalability on object storage.
Grafana Alloy — Unified Collector
Grafana Alloy (GA from 2024, replacing Grafana Agent) is a unified telemetry collector that inherits and merges many previous tools:
- Replace Promtail (log collector for Loki)
- Replace Prometheus remote_write agent
- Replaces OTel Collector for many use cases
- Replace Grafana Agent (predecessor)
River DSL Configuration__HTMLTAG_186___
Alloy uses River DSL — Grafana's own configuration language, based on HCL (Terraform). River has the ability to declare pipelines with interconnected components:
// Collect logs từ Kubernetes pods
loki.source.kubernetes "pods" {
  targets    = discovery.kubernetes.pods.targets
  forward_to = [loki.write.local.receiver]
}

// Discover Kubernetes pods
discovery.kubernetes "pods" {
  role = "pod"
}

// Write logs to Loki
loki.write "local" {
  endpoint {
    url = "http://loki:3100/loki/api/v1/push"
  }
}

// Collect metrics via Prometheus scrape
prometheus.scrape "default" {
  targets    = prometheus.operator.servicemonitors.targets
  forward_to = [prometheus.remote_write.mimir.receiver]
}

// Forward metrics to Prometheus/Mimir
prometheus.remote_write "mimir" {
  endpoint {
    url = "http://mimir:9009/api/v1/push"
  }
}
Collect Metrics, Logs, Traces From An Agent
Instead of running 3-4 separate DaemonSets (Promtail, node-exporter, OTel Collector...), Alloy allows running a single DaemonSet that takes care of them all. This minimizes:
- Number of Pods running on each node
- Overhead of container runtime__HTMLTAG_197___
- Complexity of configuration management__HTMLTAG_199___
- Network connections to backends
Recommended Stack 2026
Based on operational realities and community trends, here is the recommended observability stack for Kubernetes in 2026:
Components Main
- Metrics: Prometheus + kube-state-metrics + node-exporter
- Logs: Loki (with object storage backend for production)
- Traces: Grafana Tempo
- Visualization: Grafana
- Collector: Grafana Alloy (DaemonSet per node)
- Instrumentation Standard: OpenTelemetry
Architecture Flow
The data flow in this stack is as follows:
# Layer 1: Data Sources
[Application Pods]  →  OTel SDK / auto-instrumentation
[Kubernetes API]    →  kube-state-metrics
[Node OS]          →  node-exporter

# Layer 2: Collection
[Grafana Alloy DaemonSet] ← scrape metrics, collect logs, receive traces via OTLP

# Layer 3: Storage Backends
[Alloy] → [Prometheus]   (metrics, 15 days retention)
[Alloy] → [Loki]         (logs, with S3 backend)
[Alloy] → [Tempo]        (traces, with S3 backend)

# Layer 4: Visualization
[Prometheus] → [Grafana]
[Loki]       → [Grafana]
[Tempo]      → [Grafana]
The strength of this architecture is that all visualizations go through one door: Grafana. You can drill down from metrics → logs → traces without leaving Grafana UI, and can correlate data by trace ID or time range.
kube-prometheus-stack Helm Chart
Instead of installing each component one by one, kube-prometheus-stack is an integrated all-in-one Helm chart:
- Prometheus Operator
- Prometheus instances
- AlertManager
- Grafana
- kube-state-metrics__HTMLTAG_257___
- node-exporter
- Default dashboards and alert rules for Kubernetes__HTMLTAG_261___
# Add Helm repository
helm repo add prometheus-community https://prometheus-community.github.io/helm-charts
helm repo update

# Install kube-prometheus-stack
helm install kube-prometheus-stack prometheus-community/kube-prometheus-stack \
  --namespace monitoring \
  --create-namespace \
  --values values.yaml
Basic values.yaml file to get started:
grafana:
  adminPassword: "your-secure-password"
  persistence:
    enabled: true
    size: 10Gi
  ingress:
    enabled: true
    hosts:
      - grafana.example.com

prometheus:
  prometheusSpec:
    retention: 15d
    storageSpec:
      volumeClaimTemplate:
        spec:
          storageClassName: standard
          accessModes: ["ReadWriteOnce"]
          resources:
            requests:
              storage: 50Gi

alertmanager:
  alertmanagerSpec:
    storage:
      volumeClaimTemplate:
        spec:
          storageClassName: standard
          resources:
            requests:
              storage: 5Gi
After installing kube-prometheus-stack, you have full metrics and alerting for your Kubernetes cluster. The next step is to add Loki (logs) and Tempo (traces) to complete the observability stack.
Summary
Observability is not a feature that can be added later — it needs to be designed from the ground up. In 2026, OpenTelemetry has become the undisputed standard, and the PLG stack with Grafana Alloy is the most realistic choice for most Kubernetes teams.
In the next lessons, we will go deeper into each component:
- Lesson 29: Prometheus Operator, ServiceMonitor, PromQL, AlertManager
- Lesson 30: Loki, Tempo, and correlated observability
- Lesson 31: Debugging and troubleshooting Kubernetes
- Practice 7: Deploy the entire stack and practice end-to-end