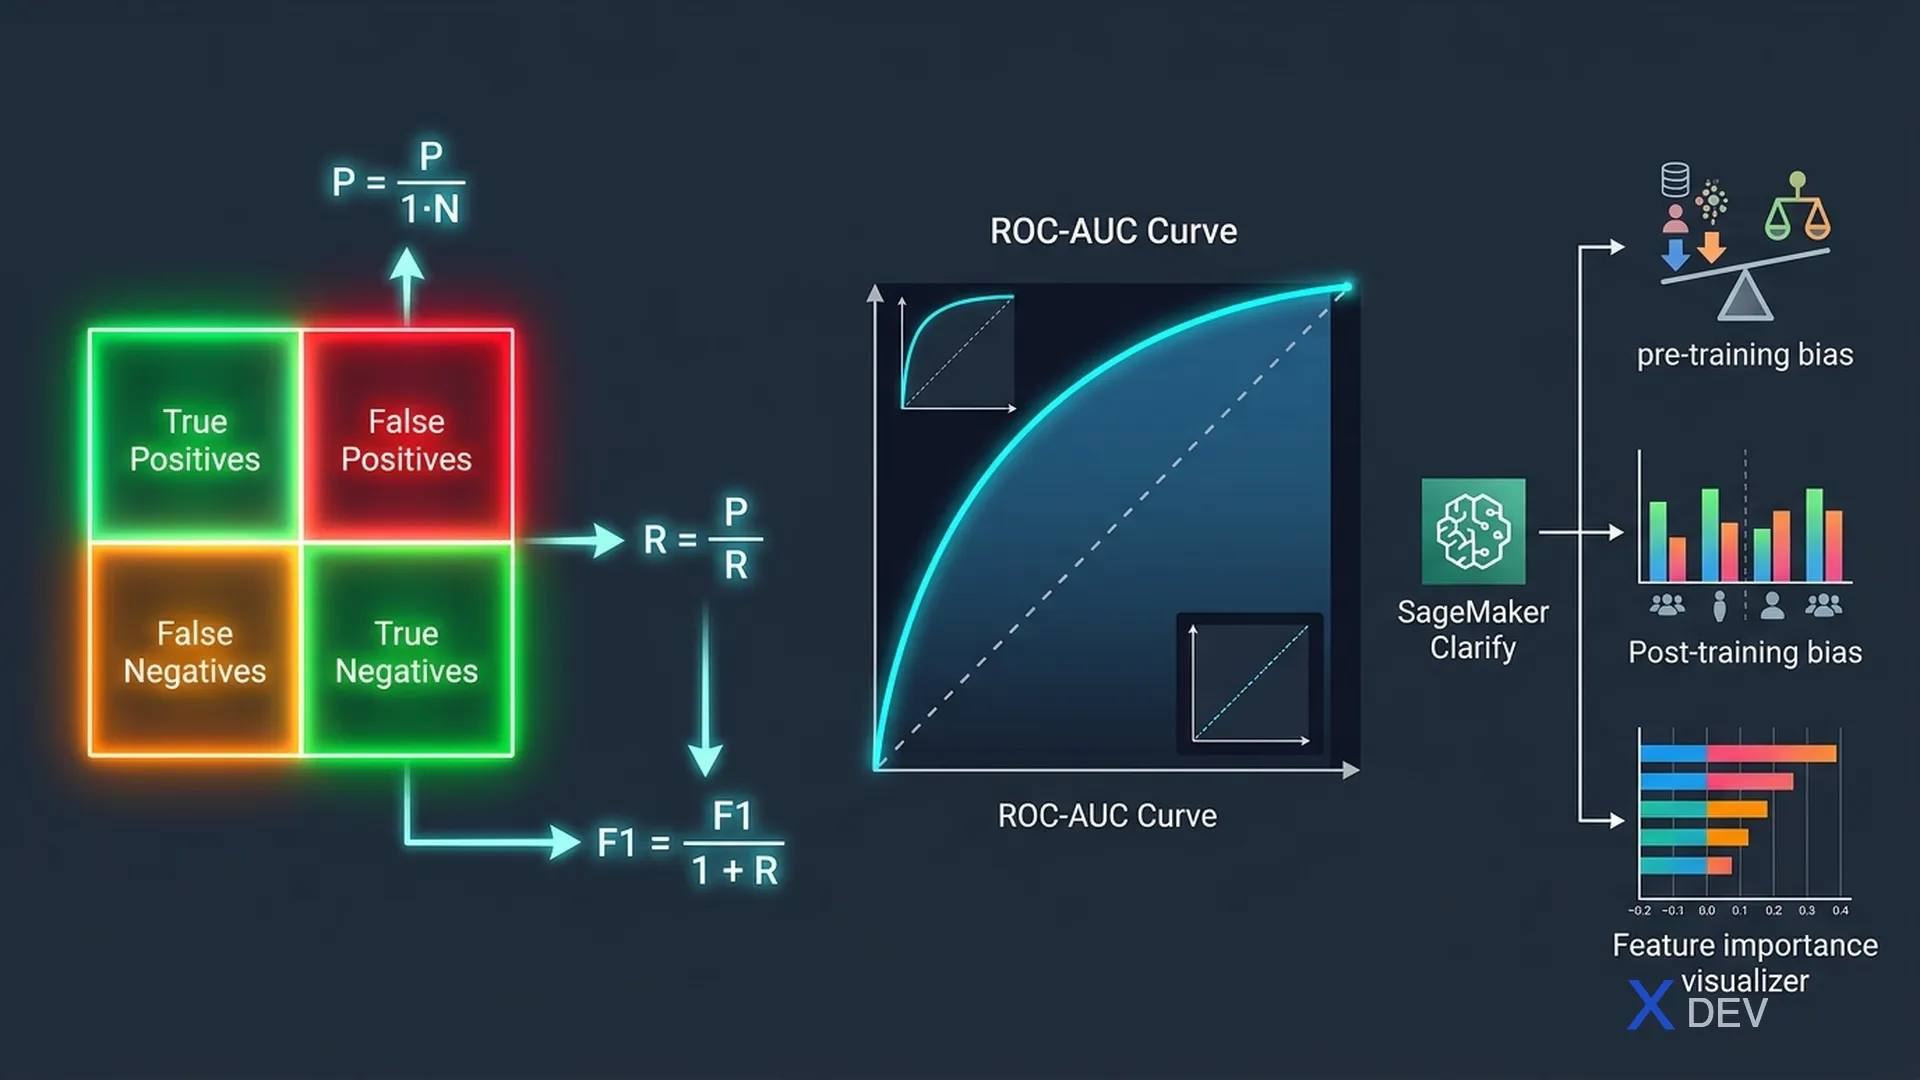
Model Evaluation: Classification metrics (AUC-ROC, F1), Regression metrics (RMSE, MAE), và Confusion Matrix
1. Classification Metrics
Chọn metric đúng là một trong các kỹ năng quan trọng nhất của ML Engineer. Đề thi MLS-C01 thường cho scenario và hỏi metric phù hợp.
1.1. Confusion Matrix
                 Predicted
                 Positive  Negative
Actual Positive │   TP   │   FN   │  ← Recall = TP / (TP + FN)
       Negative │   FP   │   TN   │

Precision  = TP / (TP + FP)   ← of all predicted positive, how many are correct?
Recall     = TP / (TP + FN)   ← of all actual positive, how many did we catch?
F1 Score   = 2 × (P × R) / (P + R)   ← harmonic mean
Accuracy   = (TP + TN) / Total
| Metric | Optimize When | Real-World Example |
|---|---|---|
| Precision | FP cost is high — don't want false alarms | Spam filter (don't block legitimate email) |
| Recall (Sensitivity) | FN cost is high — don't miss positives | Cancer detection (find all cancer patients) |
| F1 Score | Balance Precision and Recall, imbalanced data | Fraud detection |
| Accuracy | Balanced classes only | Multi-class, balanced datasets |
| AUC-ROC | Ranking quality, threshold-independent | Credit scoring, ad ranking |
| PR-AUC | Imbalanced, care about minority class | Fraud, medical diagnoses |
Exam tip: Kịch bản hay gặp — "Medical diagnosis, missing cancer is worse than false positive" → optimize Recall. "Spam detector, blocking good emails is bad" → optimize Precision. Imbalanced data → dùng F1 hoặc AUC-ROC, không dùng Accuracy.
2. Regression Metrics
| Metric | Formula | Sensitivity to Outliers | Use Case |
|---|---|---|---|
| RMSE | √(mean(errors²)) | High — penalizes large errors | When large errors are unacceptable (price prediction) |
| MAE | mean(|errors|) | Low — equal weight all errors | Robust for outliers, demand forecasting |
| R² (R-squared) | 1 - SS_res/SS_tot | Medium | Proportion of variance explained (0–1) |
| MAPE | mean(|error/actual|×100) | High when actuals near 0 | Percentage error, easy business interpretation |
3. Cross-Validation
| Strategy | How It Works | Best For |
|---|---|---|
| Hold-out Split | Train/Val/Test split (e.g., 70/15/15) | Large datasets, fast evaluation |
| K-Fold CV | K subsets, train on K-1, evaluate on 1, repeat K times | Medium datasets, robust estimate |
| Stratified K-Fold | Same as K-Fold but maintains class proportions each fold | Imbalanced classification |
| Leave-One-Out (LOOCV) | N-fold (each sample is test once) | Very small datasets |
| Time-Series Split | Training window grows forward — no future data in training | Time series data |
Exam tip: Time series data PHẢI dùng time-based splits, không được shuffle rồi dùng K-Fold thông thường — sẽ leak future data vào training.
4. SageMaker Clarify — Bias & Explainability
SageMaker Clarify phát hiện bias trong data/model và cung cấp model explainability sử dụng SHAP values.
| Feature | What It Does | Output |
|---|---|---|
| Pre-training bias detection | Analyzes raw data before training | Bias metrics: CI, DPL, KL, JS |
| Post-training bias detection | Evaluates model predictions for bias | Metrics: DPPL, DI, DCO, RD |
| Model Explainability | SHAP values cho feature importance | Feature weight contribution per prediction |
SHAP Explainability Example (Loan Approval):

Feature            SHAP Value  Contribution
─────────────────────────────────────────────
credit_score       +0.42       ↑ approval
income             +0.28       ↑ approval
debt_ratio         -0.35       ↓ approval
employment_years   +0.15       ↑ approval
age                -0.02       minimal impact
5. A/B Testing với Production Variants
SageMaker Endpoints hỗ trợ Production Variants — chạy nhiều models versions cùng lúc với traffic splitting.
Endpoint with A/B Testing:

          ┌──────────────────────────────┐
 Request ─→  SageMaker Endpoint         │
          │                              │
          │  Variant A (v1): 80% traffic │──→ Model v1 (current)
          │  Variant B (v2): 20% traffic │──→ Model v2 (candidate)
          └──────────────────────────────┘
                        ↓
                 Compare metrics, shift traffic gradually
6. Cheat Sheet — Evaluation Metrics
| Scenario | Best Metric |
|---|---|
| Medical diagnosis (FN is critical) | Recall (Sensitivity) |
| Spam filter (FP is critical) | Precision |
| Imbalanced fraud detection | F1 Score, AUC-ROC |
| House price prediction (outliers matter) | RMSE |
| Demand forecasting (robust) | MAE |
| Explain individual prediction | SHAP (via SageMaker Clarify) |
7. Practice Questions
Q1: A hospital wants to build a model to detect early-stage cancer. Missing an actual cancer case is more dangerous than a false positive. Which metric should be OPTIMIZED?
- A) Precision
- B) Recall ✓
- C) Accuracy
- D) RMSE
Explanation: Recall = TP / (TP + FN). Optimizing Recall minimizes False Negatives (missed cancer cases), which is the critical concern here. Precision optimizes against False Positives, Accuracy is misleading for imbalanced medical data, and RMSE is for regression.
Q2: A company wants to gradually test a new model version in production while keeping the existing model as fallback. Which SageMaker feature provides this capability?
- A) SageMaker Experiments
- B) SageMaker Pipelines
- C) Production Variants on SageMaker Endpoints ✓
- D) SageMaker Model Monitor
Explanation: SageMaker Endpoints support Production Variants, allowing multiple model versions to run simultaneously with configurable traffic weights. This enables A/B testing and canary deployments without downtime.
Q3: A model for predicting house prices has RMSE=50,000 and MAE=20,000. This indicates the presence of what?
- A) High bias
- B) Data leakage
- C) Outliers driving up RMSE ✓
- D) Underfitting
Explanation: When RMSE is significantly higher than MAE, it indicates outliers — since RMSE squares errors, it penalizes large errors much more than MAE. The gap (50k vs 20k) suggests some predictions have very large errors (outliers in target variable).