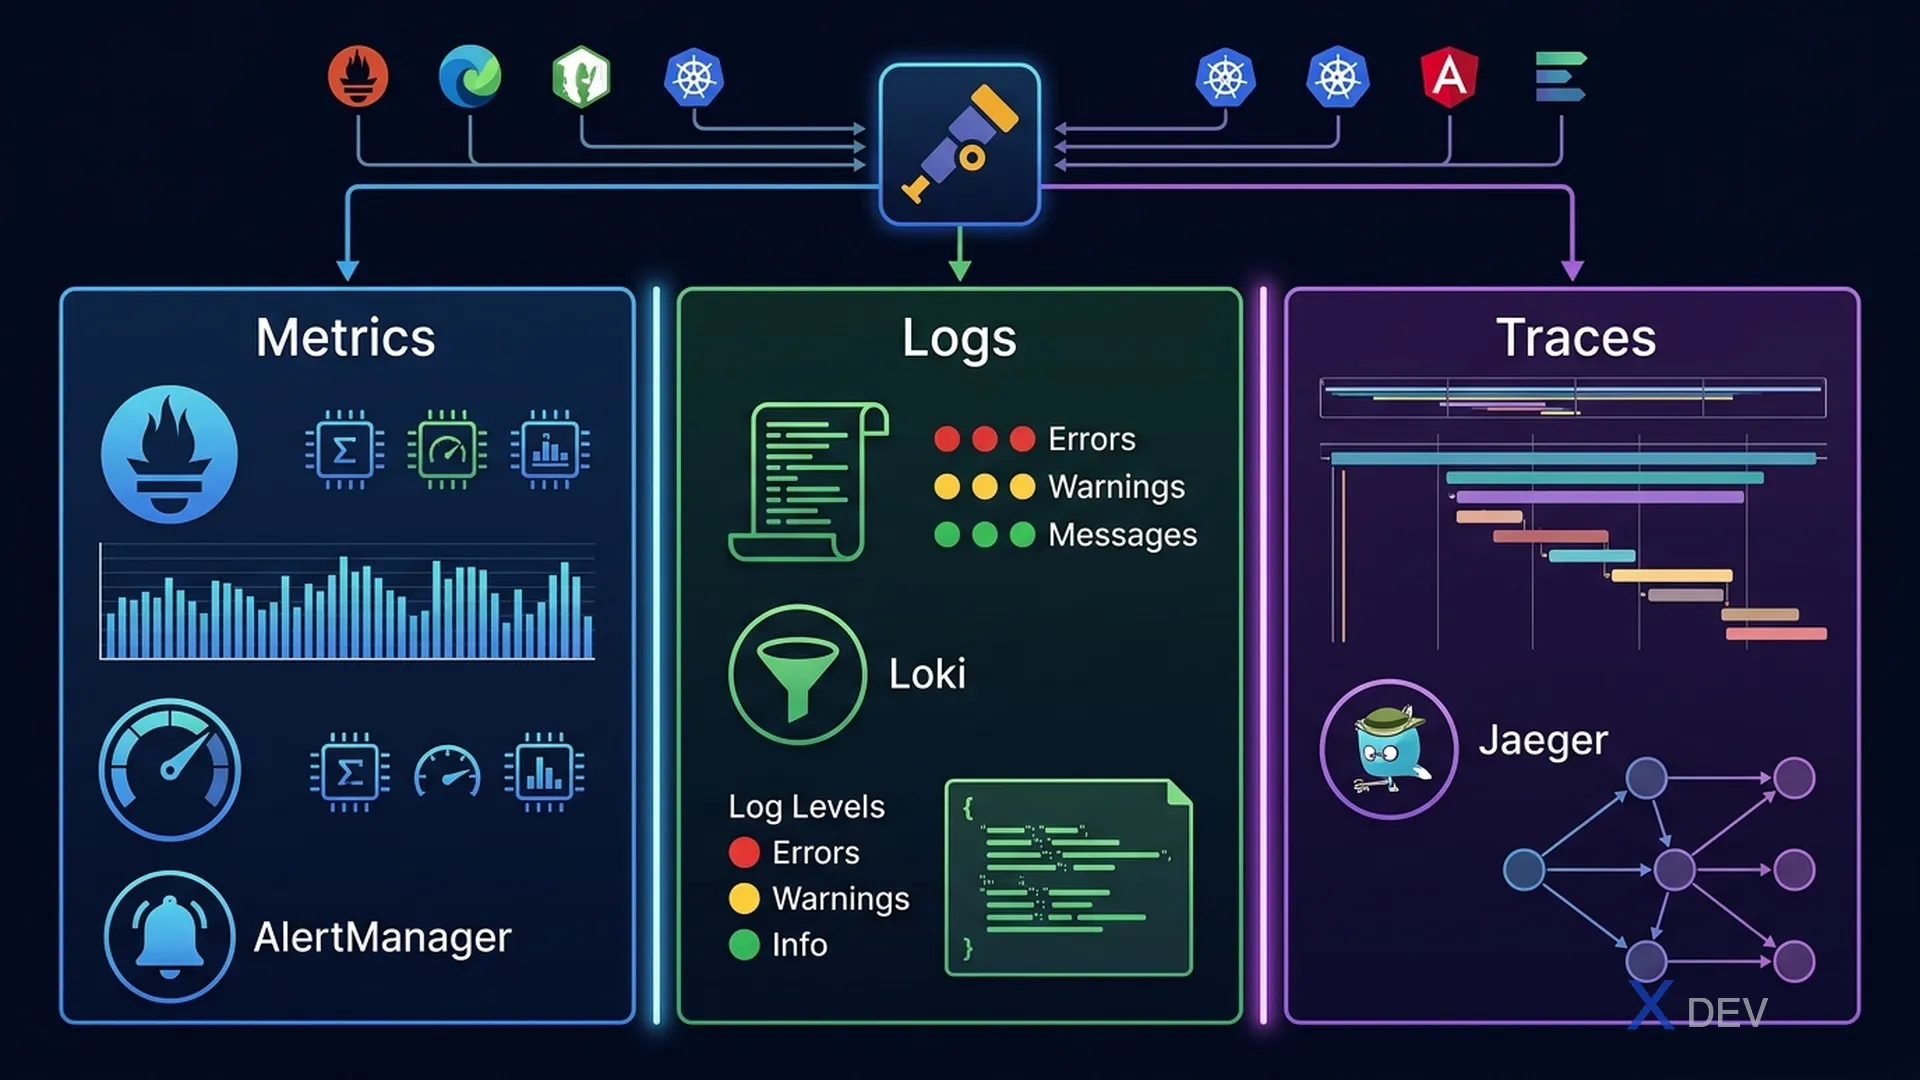
1. Ba Trụ Cột của Observability
Observability là khả năng hiểu trạng thái nội tại của một hệ thống qua các signals từ bên ngoài. Gồm 3 trụ cột:
| Pillar | Là gì | Trả lời câu hỏi | Tool |
|---|---|---|---|
| Metrics | Số liệu tổng hợp theo thời gian | "Hệ thống đang ở trạng thái nào?" | Prometheus + Grafana |
| Logs | Dòng text event từ từng service | "Điều gì đã xảy ra?" | Loki, Elasticsearch, Fluentd |
| Traces | Luồng request qua nhiều services | "Request đi qua đâu và mất bao lâu?" | Jaeger, Zipkin, Tempo |
User request fails → Use 3 pillars:

  METRICS: CPU spike at 14:05?
  LOGS: Error "DB timeout" in service B
  TRACES: Request A→B→C, step B took 8s

  → Root cause: Service B DB connection pool exhausted
Exam tip: KCNA thường hỏi "welche tool" cho từng pillar. Prometheus = metrics. Grafana = visualization. Jaeger = distributed tracing. Loki = log aggregation.
2. Prometheus & Metrics
Prometheus là CNCF graduated project cho monitoring và alerting. Pull-based: Prometheus scrapes metrics từ targets.
Prometheus Architecture:
  App (exposes /metrics)
       ↑ scrape
  Prometheus Server ──► Alert Manager ──► Slack/PagerDuty
       │
Grafana (query PromQL → charts)| Metric Type | Ý nghĩa | Ví dụ |
|---|---|---|
| Counter | Chỉ tăng (reset khi restart) | http_requests_total |
| Gauge | Tăng/giảm tự do | memory_usage_bytes |
| Histogram | Distribution, quantile | request_duration_seconds |
| Summary | Pre-computed quantiles | response_size_summary |
3. OpenTelemetry (OTel)
OpenTelemetry là CNCF standard cho thu thập telemetry (metrics, logs, traces) với vendor-neutral SDK và Collector.
OpenTelemetry Flow:
  App (instrumented with OTel SDK)
       │ OTLP (protocol)
  OTel Collector (receive, process, export)
       │
  ┌────┴────┐
 Jaeger   Prometheus   Loki
(traces)  (metrics)   (logs)
Exam tip: OpenTelemetry tách vendor-specific code ra khỏi apps — chỉ cần thay đổi OTel Collector config để switch từ Jaeger sang Zipkin mà không cần sửa app code.
4. Observability trong Kubernetes
| Component | Cung cấp |
|---|---|
| kubelet /metrics | Node resource metrics cho Prometheus |
| metrics-server | CPU/Memory cho kubectl top, HPA |
| kube-state-metrics | Kubernetes object state (Pod, Deployment status) |
| Prometheus Operator | Deploy Prometheus stack với CRDs (ServiceMonitor) |
| Loki + Promtail | Log aggregation (Promtail thu thập logs từ nodes) |
kubectl debugging commands
kubectl logs pod-name              # Current container logs
kubectl logs pod-name --previous   # Last crashed container logs
kubectl logs -f pod-name           # Stream live logs
kubectl describe pod pod-name      # Events + status details
kubectl top pod                    # CPU/Memory (needs metrics-server)
kubectl top node                   # Node resource usage
5. Cheat Sheet
| Câu hỏi exam | Đáp án |
|---|---|
| 3 pillars of observability? | Metrics, Logs, Traces |
| Distributed tracing tool? | Jaeger, Zipkin, Tempo |
| Kubernetes metrics collection? | Prometheus |
| Visualization dashboard? | Grafana |
| Vendor-neutral telemetry standard? | OpenTelemetry |
| kubectl top cần gì? | metrics-server |
6. Practice Questions
Q1: A team needs to trace how a single HTTP request flows through 5 microservices to find which service adds the most latency. Which observability tool should they use?
- A) Prometheus
- B) Grafana
- C) Jaeger ✓
- D) Loki
Explanation: Distributed tracing (Jaeger, Zipkin) tracks a request's entire flow across multiple services, showing each hop's latency and relationships. Prometheus shows aggregate metrics; Loki shows logs; Grafana is visualization.
Q2: What type of Prometheus metric would you use to track the total number of HTTP requests served since startup?
- A) Gauge
- B) Histogram
- C) Counter ✓
- D) Summary
Explanation: Counter is a monotonically increasing metric — it only goes up (or resets to 0 on restart). Perfect for tracking cumulative events like requests, errors, or bytes transferred. Gauge is for values that go up and down (like memory usage).
Q3: Which framework allows developers to instrument their application once and export telemetry to multiple backends (Jaeger, Prometheus, etc.) without code changes?
- A) Prometheus client libraries
- B) OpenTelemetry ✓
- C) Kubernetes metrics-server
- D) Grafana Agent
Explanation: OpenTelemetry provides vendor-neutral APIs and SDKs for generating traces, metrics, and logs. The OTel Collector routes telemetry to different backends. Switching backends requires only Collector config changes, not application code.