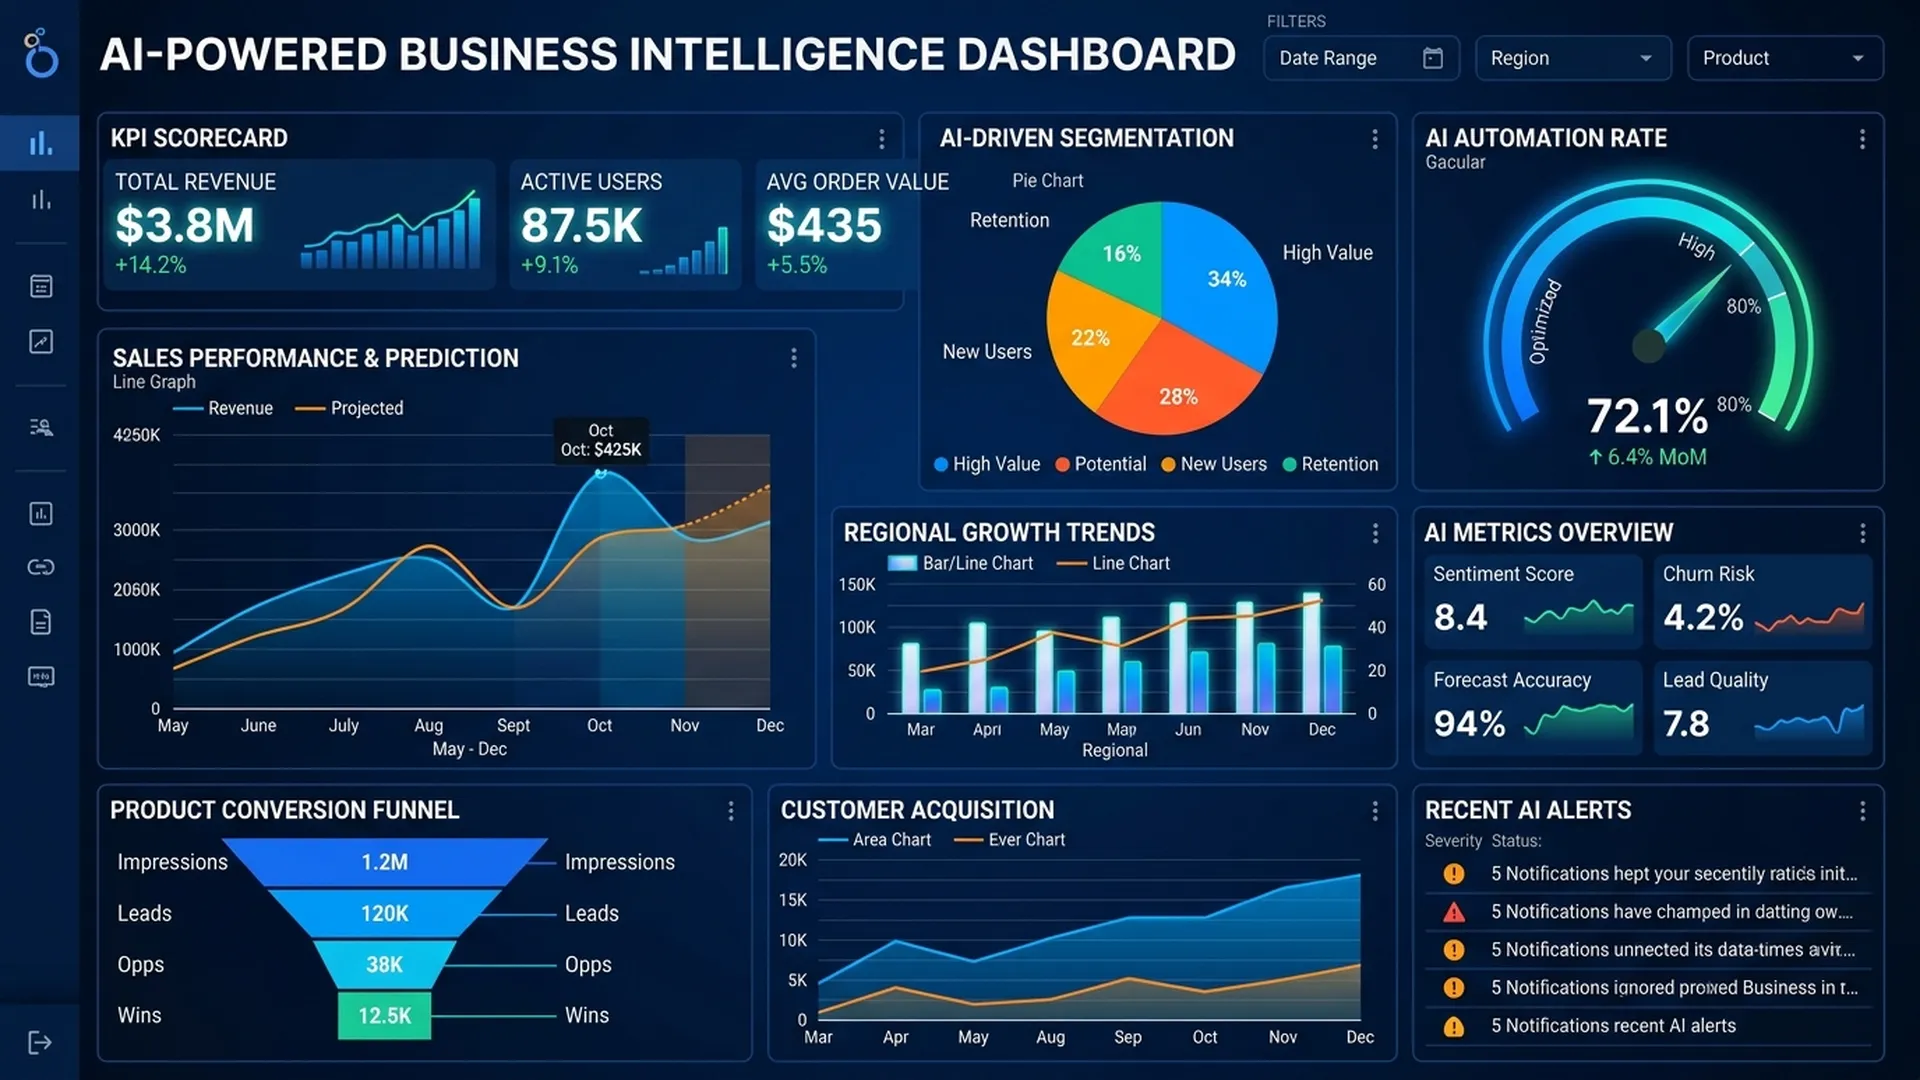
BA không cần là data analyst để xây dashboard. Với Looker Studio hay Power BI, nếu biết data nào cần theo dõi và tại sao, bạn có thể tạo dashboard hữu ích trong vài giờ.
1. Metric Framework cho AI Feature Dashboard
BA cần 3 lớp metric:
Layer 1: Business Outcome Metrics
"AI feature có tạo ra value cho business không?"
| Metric | Mô tả | Ví dụ |
|---|---|---|
| Automation rate | % requests AI tự xử lý | "AI tự giải quyết 73% ticket" |
| Time saved | Thời gian tiết kiệm so với manual | "Giảm 4.2 phút/ticket" |
| Error rate post-AI | Tỷ lệ lỗi sau khi có AI | "Giảm từ 12% xuống 3.5%" |
| Cost per outcome | Chi phí AI so với manual cost | "$0.03/ticket vs $1.20 manual" |
Layer 2: AI Quality Metrics
"AI có hoạt động đúng không?"
| Metric | Mô tả | Alert threshold |
|---|---|---|
| Accuracy (rolling 7d) | % predictions đúng | < 85% |
| Human override rate | % cases agent phải override AI | > 25% |
| Confidence distribution | Histogram of confidence scores | Shift > 10% |
| Latency P95 | 95th percentile response time | > 3 seconds |
Layer 3: Operational Metrics
"Hệ thống có ổn định không?"
| Metric | Mô tả | Alert |
|---|---|---|
| API error rate | % request trả về lỗi | > 1% |
| Queue depth | Số cases đang chờ human review | > SLA capacity |
| Throughput | Requests/hour | Drop > 50% baseline |
2. Dashboard Design cho Stakeholder khác nhau
2.1 Executive Dashboard (Monthly Review)
Audience: C-level, Director
Purpose: ROI và business impact
Keep it to: 4-5 numbers + 1-2 trend charts
┌─────────────────────────────────────────────────────┐
│  AI Feature Health Dashboard — [Month YYYY]         │
├─────────────┬─────────────┬────────────┬────────────┤
│  Cases      │  AI Auto    │  Time      │  Cost      │
│  Processed  │  Handled    │  Saved     │  Saved     │
│  12,450     │  73%        │  847 hours │  $34,200   │
│  (+8% MoM)  │  (+3% MoM)  │            │  vs manual │
├─────────────┴─────────────┴────────────┴────────────┤
│  [Trend Chart: Automation Rate over 6 months]       │
└─────────────────────────────────────────────────────┘
2.2 Operations Dashboard (Daily Monitoring)
Audience: BA + Ops team
Purpose: Detect issues early
Include: Real-time metrics, alerts
Key widgets:
- Live accuracy (rolling 24h)
- Human override rate today vs last week
- Queue depth + SLA breach count
- Error rate + latency
2.3 Sprint Review Dashboard
Audience: Dev team + PM
Purpose: Sprint progress
Include: Stories done vs planned, bugs found, AC coverage
3. Tool Comparison
| Tool | Strengths | Limitations | BA Fit |
|---|---|---|---|
| Looker Studio (Google) | Free, easy Google Sheets integration | Limited visuals | ✅ Great for quick setup |
| Power BI | Powerful, Office 365 integration | Paid, steeper learning | ✅ Great for enterprise |
| Metabase | SQL-friendly, self-hosted option | Need DB access | ⚠️ Need tech help for setup |
| Tableau | Best visuals | Expensive | ❌ Overkill for BA |
| Grafana | Ops/ML monitoring | Too technical | ❌ Not for BA |
4. Step-by-step: Looker Studio cho BA
Bước 1: Xác định data source
Yêu cầu Dev export log ra Google Sheets hoặc BigQuery:
Columns needed:
- timestamp
- request_id
- ai_prediction
- confidence_score
- human_override (true/false)
- override_reason
- resolution_time_seconds
Bước 2: Connect data source
Looker Studio → Add data → Google Sheets (hoặc BigQuery)
Bước 3: Tạo các charts cần thiết
Chart 1: Scorecard — "Automation Rate"
  Metric: COUNT(WHERE human_override = false) / COUNT(*) × 100

Chart 2: Time Series — "Daily Accuracy (7-day rolling)"
  Dimension: Date
  Metric: % correct predictions

Chart 3: Bar Chart — "Top Override Reasons"
  Dimension: override_reason
  Metric: COUNT(*)

Chart 4: Gauge — "Today's Override Rate"
  Reference line: target threshold
Bước 4: Setup automated refresh
Trong Google Sheets: Tools → Apps Script → setTrigger(daily refresh from DB)
5. Dashboard Governance
BA cần establish:
| Quy tắc | Mô tả |
|---|---|
| Owner | Ai là người maintain dashboard? (thường là BA) |
| Refresh rate | Daily/hourly/realtime tùy metric |
| Distribution | Ai nhận email summary? (weekly) |
| Review cadence | Metric definitions review mỗi quý |
| Alert routing | Khi alert trigger, ai nhận và làm gì? |
Kết luận
Dashboard không phải data analyst work — nó là BA communication tool. Mục tiêu không phải là đẹp hay phức tạp, mà là đúng metric, đúng audience, đúng frequency. Một dashboard 5 charts nhưng được xem mỗi ngày có giá trị hơn dashboard 20 charts không ai mở.